Home Blog Page 2

Metaplanet Stock Could Crash 25%, Is Bitcoin Strategy Backfiring?

0

Key Insights:

  • Metaplanet stock could crash 25% if it fails to hold $1,400 level.
  • Metaplanet now owns 11,111 BTC worth ~$1.07B, ranking among the top 10 corporate Bitcoin holders globally.

Over the past week, the Japanese publicly listed company Metaplanet Stock (3350), known for its Bitcoin (BTC) strategy, has plummeted over 27% and is now making waves in the cryptocurrency space. With its continued decline, Metaplanet has reached a make-or-break situation.

Why is Metaplanet Stock Price Falling?

This price drop began following Metaplanet’s issuance of 54 million company shares to expand its Bitcoin holdings. The new shares were issue with the help of institutional investor EVO Fund, valued at 74.9 billion yen, equivalent to $515 million.

Japanese Bitcoin Holding Firm Metaplanet Strategy

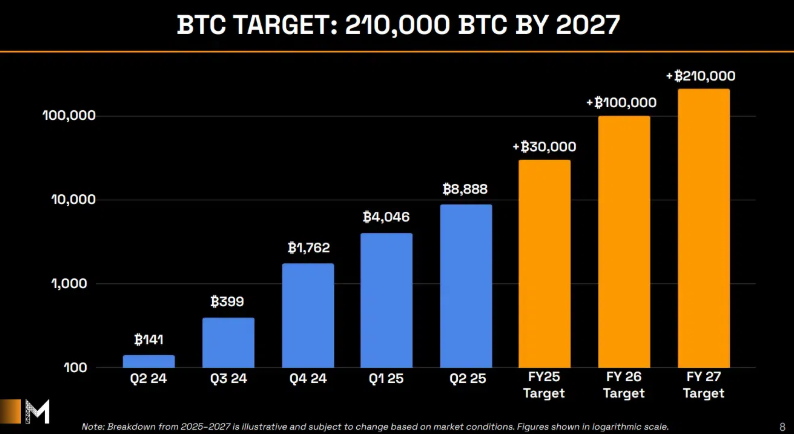
With its Bitcoin strategy, the company aims to become the largest corporate Bitcoin holder in Asia. Additionally, the firm plans to hold 1% of the total Bitcoin supply by the end of 2027.

Before achieving this substantial BTC goal, the company recently shared a blueprint outlining its quarterly and annual Bitcoin acquisition targets through 2027. According to the data, Metaplanet plans to acquire nearly 30,000 BTC by FY25, 100,000 BTC by FY26, and 210,000 BTC by FY27.

Metaplanet Bitcoin Strategy
Metaplanet Bitcoin Strategy | Source: Metaplanet

Metaplanet stock, with its strategic Bitcoin acquisitions, now holds 11,111 BTC worth nearly $1.07 billion and currently ranks among the top 10 corporate BTC holders in the world.

Looking at Metaplanet’s Bitcoin strategy, it appears to be following in the footsteps of Michael Saylor’s approach — raising funds through stock offerings to purchase Bitcoin.

However, the Bitcoin accumulation strategy began when the price of Bitcoin (BTC) was below $20,000, and it is now one of the most profitable crypto-focused firms in the United States.

Stock Performance and Current Momentum

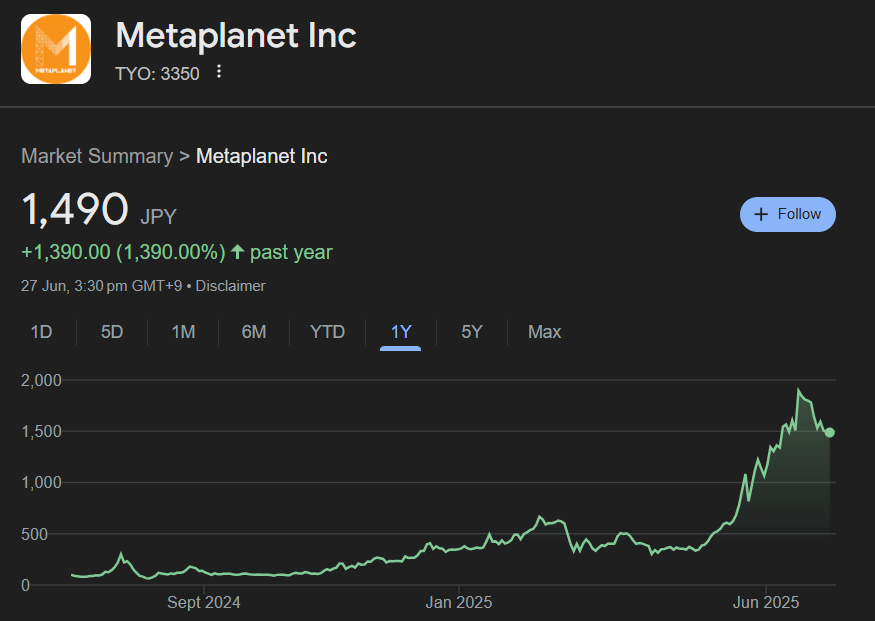
Besides all this, Metaplanet stock is trading near $1,490 and has recorded a price drop of 1.26% today. Over the past week, the firm has registered a decline of 10.30%.

Metaplanet Stock Price
Metaplanet Stock Price | Source: Google Finance

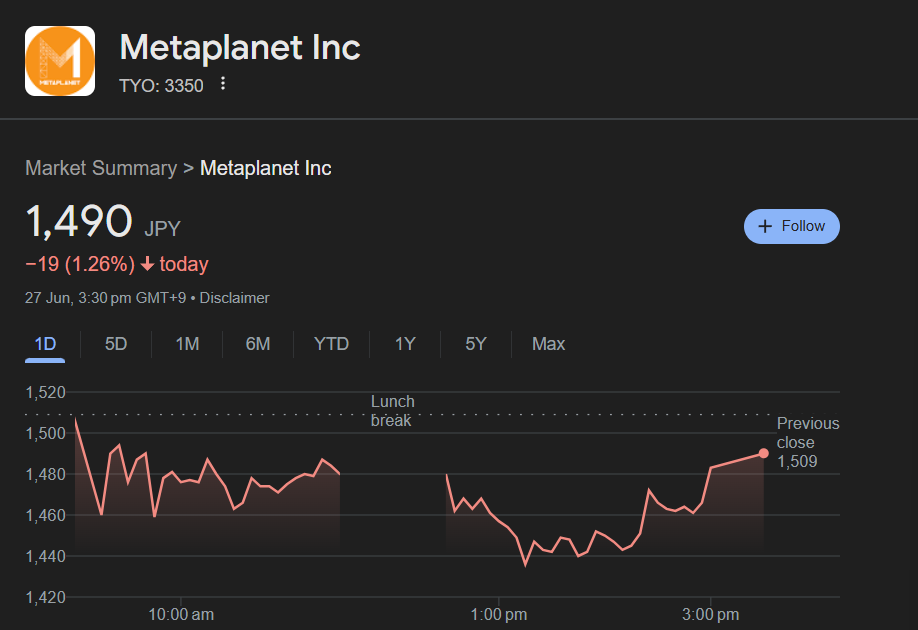
Despite the notable price drop in the past week, Metaplanet shareholders have made substantial profits over the past year. Data from Google Finance reveals that Metaplanet stock has surged by an impressive 1,390% over the past year—far outperforming many financial giants across the world.

Metaplanet Stock Price
Metaplanet Stock Price | Source: Google Finance

Metaplanet Stock Price Action and Key Technical Analysis

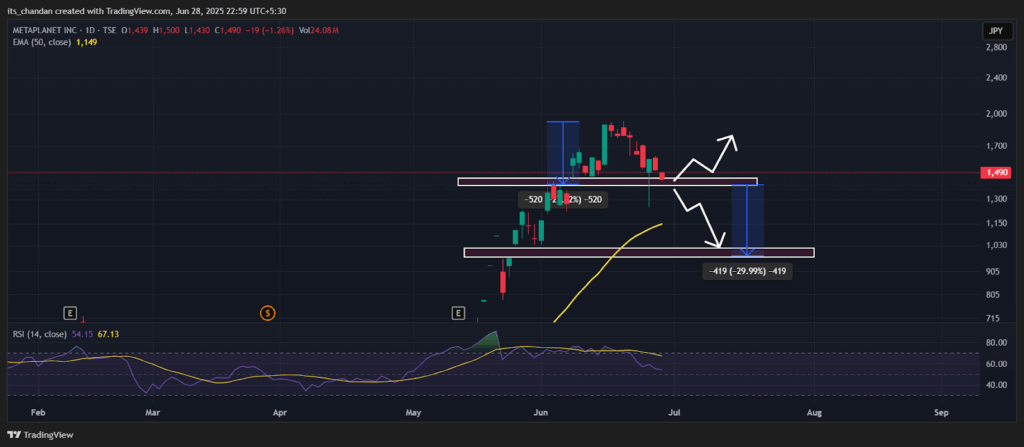
According to expert technical analysis, Metaplanet stock appears bearish and is poised for significant downside momentum in the coming days.

As per the daily chart, the asset has successfully formed a bearish head and shoulders pattern and is on the verge of a breakdown.

Metaplanet Stock Daily Chart
Metaplanet Stock Daily Chart | Source: Trading View

Metaplanet Price Prediction

Based on recent price action and historical patterns, if the asset breaches the neckline of the head and shoulders pattern and closes a daily candle below the $1,400 mark, it could pave the way for further downside momentum.

If this happens, there is a strong possibility that the asset could experience a price drop of over 25%, potentially reaching the $1,050 level in the near future.

On the other hand, if sentiment shifts and Metaplanet stock holds above the $1,400 level, it could gain upside momentum. If not, the price may enter a consolidation phase.

At press time, Metaplanet’s Relative Strength Index (RSI) stands at 54, indicating that the asset is still near oversold territory and may see a price reversal if sentiment shifts.

Kraken Crypto Launches Krak App After Winning EU License

0

Key Insights:

  • Kraken Crypto has secured a MiCA license from the Central Bank of Ireland.
  • Kraken has launched Krak, a payments app that allows users to send and receive money in 300+ countries, supporting both fiat currencies.

Kraken Crypto is one of the leading and most trusted cryptocurrency exchanges in the United States. It now appears to be making a bold move, not just in crypto, but in other financial offerings as well.

In addition, the exchange is giving tough competition to the largest U.S. crypto exchange, Coinbase, and seems to be expanding into other countries.

Kraken Crypto Exchange Wins License to Operate Across EU

Amid the volatile market, Kraken crypto exchange has recently secured a regulatory license under the European Union. This license is based entirely on the European Union’s Markets in Crypto-Assets (MiCA) regulation, as the company announced on June 25, 2025.

However, this announcement comes a week after Coinbase received a similar regulatory license in Luxembourg.

Following this approval, the Central Bank of Ireland has authorized Kraken crypto exchange to offer its wide range of crypto services across the 27 EU member states. This marks a pivotal milestone for Kraken, as it has unlocked the path to expand and scale its crypto business in other countries.

Upon achieving this milestone, Arjun Sethi, co-CEO of Kraken crypto exchange, stated, “Securing a license from the Central Bank of Ireland, with its long heritage and experience as a rigorous financial regulator, isn’t just about compliance. It’s a powerful signal of Kraken’s commitment to expanding the crypto ecosystem through responsible innovation.”

He further stated, “We’re deeply grateful to the Central Bank of Ireland for its professionalism, and to the Irish Government and IDA for their consistent support. This collaboration is a blueprint for how public and private sectors can work together to build a more secure, innovative financial future for Europe, and we’re proud to be leading the way.”

With this license, Kraken crypto exchange is able to extend its regulated offerings to millions of clients across the EU. This not only allows it to give tough competition to other major exchanges but also enhances its significant growth opportunities across retail, professional, and institutional client segments, including in spot trading, derivatives, and payments.

Kraken Launches Peer-to-Peer Payment App: Krak

In addition to this development, Kraken crypto exchange has also stepped into the peer-to-peer payment space. On June 26, 2025, the exchange debuted a new payments app called Krak, which allows users to send and receive payments in over 300 countries.

Reports reveal that this payment app will not only support peer-to-peer transactions but also offer crypto services in just 110 countries.

According to the news, Kraken Crypto’s Krak app supports all major currencies, including EUR, USD, INR, and others. In addition to fiat currencies, it also supports cryptocurrencies and tokens. Mark Greenberg, Kraken’s Global Head of Consumer, stated that the app will have multiple use cases across different countries.

Following the launch of Krak app, the co-CEO said, “With Krak, we’re taking a bold step toward rebuilding what we consider to be the most important layer of the global economy: How people move and use money.”

He also noted, “If you’re in the United States—or if you’re in Canada, like me—it’s actually really hard to move money to friends in the United States, and I can use Krak to do that. If you’re in Latin America, in a country with higher inflation, you may want to store your assets and U.S. dollar stablecoins and earn yield on those—you can do that with Krak. If you want to hold your payroll in Bitcoin and then eventually spend it on a card, you can do that.”

TRUMP Crypto Trend Turns Bearish: Is A Freefall Coming?

0

Key Insights:

  • TRUMP crypto coin appears to be struggling, and even a slight price drop could trigger a significant 16% decline.
  • Investors are seen accumulating, while traders are betting on a price drop, raising concerns and uncertainty about the asset’s next move.

After failing to sustain the bullish breakout, TRUMP crypto has now reached a key support area at $8.75. It’s not just the price touching this level; a bearish Evening Star candlestick pattern has also formed here, signaling a potentially bearish outlook for the asset.

Earlier, this support level acted as a strong resistance for TRUMP crypto, which has now turned into a key support zone.

On-Chain Metrics Reveals Mixed Sentiment

Given the current market sentiment, investors and traders seem to have differing views — some are accumulating, while others appear to be betting on short positions, according to the on-chain analytics tool.

Data reveals that exchanges have recorded an outflow of $1 million worth of TRUMP crypto over the past 48 hours.

TRUMP Spot Inflow/Outflow
TRUMP Spot Inflow/Outflow | Source: CoinGlass

This notable outflow, given the current market structure, suggests potential accumulation and appears to be a bullish factor for the meme coin, as it could reduce the ongoing selling pressure.

On the other hand, traders seem to be betting strongly on the downside. At press time, the two major levels where traders are over-leveraged are $8.74 on the lower side, which is a key support level, and $9.37 on the upper side, which is a key resistance level on the chart.

TRUMP Exchange Liquidation Map
TRUMP Exchange Liquidation Map | Source: CoinGlass

At these levels, traders have built $3.53 million worth of long positions on the lower side (support level), whereas $9.68 million worth of short positions have been built on the upper side. Observing these levels, it appears that sellers are in control and likely believe that TRUMP crypto’s price won’t cross the $9.37 level anytime soon.

One more thing traders and investors should understand is that whenever the price moves to either side and any key level gets liquidated, a strong price momentum often follows in that direction, as there will be no major liquidation levels left to hold back the movement.

At press time, TRUMP crypto stands at $8.94 and has remained relatively stable over the past 24 hours. Data reveals that the meme coin has experienced a 0.50% price decline during this period. Meanwhile, participation from traders and investors has also dropped significantly.

According to CoinMarketCap, TRUMP’s 24-hour trading volume has decreased by 14%, indicating lower activity compared to the previous day.

TRUMP Coin Price Action and Key Technical Levels

According to expert technical analysis, the TRUMP crypto price appears to be consolidating within a tight range at a key support level.

This consolidation follows the formation of an Evening Star candlestick pattern, raising concerns about whether the asset is preparing for a price decline or if the movement is simply due to overall market volatility.

TRUMPUSDT Daily Chart
TRUMPUSDT Daily Chart | Source: TradingView

Based on recent price action and historical patterns, if the current market structure and sentiment remain unchanged, there is a strong possibility that the asset’s price will either consolidate or experience a sharp decline.

This potential free fall in TRUMP crypto’s price could occur if it fails to hold above the key support level. If that happens, the price could face a downside move of over 16%, potentially dropping to the $7.30 level.

On the other hand, a TRUMP rally would only be possible if it breaks out above the key resistance level of $9.54. If this happens, the price could potentially soar by 11%.

At press time, the TRUMP crypto price was trading below the 50-day Exponential Moving Average (EMA), indicating a prevailing bearish trend and suggesting that sellers currently have the upper hand in the market.

AI Crypto TAO Trades At Discount As Technical Setup Signals Rebound

0

Key Insights:

  • TAO is a top AI crypto token at key support.
  • A falling wedge breakout suggests TAO’s bullish setup remains intact.
  • AI crypto traders eye $357 and $748 as next resistances.

The flagship token of an AI crypto project, Bittensor, TAO, has recently broken into an important accumulation area causing a new spike in interest in the token by technical traders.

At the moment, TAO costs 327.59 USD, but it has decreased by 2.64% within 24 hours, as the rest of the market has cooled.

However, its price action currently rests at a structural support area, which usually leads to reversals within the AI crypto industry.

Daily Chart Reveals Falling Wedge Reversal and Uptrend Prospects

Based on TradingView figures TAO has is on the verge of breaking out of a falling wedge, which is a bullish reversal pattern that is typical during AI cycles in the crypto market.

Having reached the low of about $163.7, the asset reversed to climb towards the price of about $480 before going into another pullback period but with a controlled movement.

The tendency of the latest decline, which is described by a minor descending channel, returned TAO to a critical support range of $300 to $320.

This is the same level as the wedge breakout retest, a major confirmation level of numerous AI crypto traders evaluating the alternative of long entries.

TAO 1-day Chart
TAO 1-day Chart | Source: X

Price history indicates that, in case this demand area holds, TAO might retrace up to the resistance trades in the range of $357, and then it may approach the resistance of $496.6.

The ultimate goal is similar to the one aforementioned due to reckoning with bullish movement in the market continuity of the AI crypto footprint.

When coming closer in the chart and zooming in to 4 hours, we can observe that TAO is moving within a close range falling corridor.

Price action has recorded a slight recovery as it touched the lower boundary of the channel with the price being at around $328.

Another major resistance zone is at around 430-450 which remains as the short-term resistance. To achieve further uptrend, TAO has to surpass the mark at $360, as it can serve as a trigger to a new impulse wave in AI crypto markets.

4-hour TAO/USDT Chart
4-hour TAO/USDT Chart | Source: TradingView

Under the price chart, the indicator of Volume Delta delta demonstrates the recent upsurge of buy-side interest, while Awesome Oscillator (AO) represents zeroing in the past time range, which may present signs of diminishing bearish pressure. Both pointers support the assertion of a conformation period prior to a directionality breakout.

AI Crypto Sector Metrics Add Context to TAO’s Current Valuation

The value of TAO is around 2.91 billion in terms of market capitalization and 24-hour trading volume is 176.93 million.

The token has high active liquidity as seen from its 6.06% volume-to-market cap ratio which demonstrates active operations against its price.

The fully diluted valuation (FDV) of TAO is 6.87B, whereas the unlocked market cap is a bit more than the realized one, namely 3.3B.

TAO Data
TAO Data | Source: CoinMarketCap

In addition to that, the profile score of TAO is quite high and is powered by its application to the material support of the decentralized machine learning networks, contributing to the fact that TAO is one of the key AI crypto-assets, along with the rest of the potentially innovative sub-sector.

In case of bulls’ entry to AI crypto story, one could watch such targets of resistance as $357, $440, and ultimately $748.3. However, a failure beneath $300 may annul this bullish form, and drive TAO back to its prior local low of $250.

At present, the existing support level is a discounting chance in the general AI crypto cycle, especially to the spectators to the pattern setups and volume dynamics.

ONDO Crypto Tops RWA Projects in Social Activity As Exciting Technical Setup Emerges

0

Key Insights:

  • ONDO leads the RWA sector in social engagement and chart strength.
  • Triple-tap demand zone suggests a high-reward, low-risk trade setup.
  • Total value locked and revenue metrics support bullish ONDO outlook.

Recent statistics revealed that ONDO crypto leads Real World Asset (RWA) project analyses in terms of social media activity.

By June 25, 2025, ONDO is deemed to have more than 4,090 posts and 433,000 interactions on various platforms translating to the highest social dominance score of 0.40 percent among all the RWA competitors. This beats the likes of SKY (0.30%), Zebec Network (0.30%), and ELYSIA (0.20%).

TOP RWA project by social activity
Snap | Source: X

The supremacy of ONDO crypto is not just a weight loss issue on the exchange, rather, it evidences spiraling community activity when the token is recording some of the technical buy signals.

This retail interest and a healthy chart setup has brought ONDO Crypto in the limelight of the traders as well as the long term RWA followers.

Third Tap into Demand Zone Sparks Accumulation Setup for ONDO Crypto

The 12-hour chart and 3-day chart give an impression of the current structure of the market of ONDO.

Price action on the 12-hour chart, put what looks like a textbook triple tap accumulation pattern evolving and the most recent move confirms the mitigation of an extreme demand developing in a higher time frame (HTF) market structure.

After the first and the second taps, the price fell again into the green area of demand making a third and clean base of support.

The area near the $0.68 to 0.71 still looks problematic as it is the level that indicates the invalidation of the currency.

This range of defense would be considered clean, and a gradual withdrawal capable of time-displacement between taps, would be a possible TCT Model 2 accumulation set up.

In case of confirmation of such a schematic, the technical target is close to $1.15, with a potential of about 14RR (risk-reward) motion.

12-hour ONDO/USDT Chart
12-hour ONDO/USDT Chart | Source: X

Although the accumulation model might not be fully confirmed, there still is a statistical inclination towards the local high at the levels of around $0.90 to 0.95.

This in-between target is in line with the 3.5RR level which will enable booking profits partially with minimum downside exposure.

At this level a partial take of 25 percent provides a realized gain of +0.875 percent on a 1 percent risk trade. At the same time, it minimizes net exposure, resulting in a risk-off position in that you can break-even or make a nominal profit even in the case of price reversing.

This type of accuracy in entry minimizes emotional tension when making a trade and enables a trader to guard capital without removing him/herself of the possibility of additional gain should extension toward the technical level of the trade near the level of $1.15 follow through.

Higher Time Frame: ATH Break Could Lead to +200% Expansion on Ondo Crypto

In the 3-day chart, zooming out on ONDO crypto, its structure shows that the ongoing pullback exists within the context of a wider range created by the 2024 highs that followed in December around the 2.20 price.

Once the current range high at around $1.15 breaks and closes successfully, a previous advanced forex pattern, a level 2 Break of Structure (BOS), will be confirmed and a continuation of the rotation to new record highs will follow.

3-day ONDO/USDT Chart
3-day ONDO/USDT Chart | Source: X

It is highlighted in the chart that it is necessary to check the change in the market structure at several levels.

The seller congestion at or around former highs might offer resistance, and should the current build up persist traders may see a subsequent ascension giving investors more than 200 per cent on current pricing of 0.77 dollars.

In addition to the technical and the sentiment, ONDO has the fundamentals working in its favor. As stated by DeFiLlama, the Total Value Locked (TVL) on the ONDO protocol demonstrates constant inflow and increased confidence in the protocol, and is at the level of 1.399 billion dollars at the time of writing. The rate of annualized revenue stands at 41.7 million whereas the fees have soared to 55.8 million. These figures have made it have a current market cap of 2.419 billion as well as a FDV of 7.657 billion.

ONDO Market Data
ONDO Market Data | Source: DefiLlama

A current price of $0.77 and the 24-hour trading volume of $125.66 million evoke the impression of a high level of liquidity and real-time demand, especially considering the growing TVL and the number of users of this token since the beginning of 2025.

Pi Crypto Value Drops 20% After Rally, Correction Or Reversal Ahead?

0

Key Insights:

  • After a sudden 40% price surge followed by a 20% drop, Pi crypto is now trading near key support at $0.515 and resistance at $0.66.
  • Despite recent price drops and reduced trading volume, community and expert opinions remain mixed.

Over the past few hours, Pi crypto value has witnessed massive fluctuations, becoming a focal point for crypto enthusiasts. The daily chart reveals that following the ceasefire announcement between Israel and Iran, the overall market experienced upward momentum.

Volatility in Pi Crypto Value

Amid this, Pi crypto saw a 40% surge in value, which has since faded as the price dropped nearly 20% in the past 24 hours.

This notable fluctuation in the asset’s price appears to be garnering significant attention from crypto enthusiasts and Pi coin holders. Additionally, it raises the question of whether the asset will continue its downward momentum or if this is just a normal correction following the massive 40% rally.

At press time, Pi crypto value stands at $0.565 and has recorded a 10% price drop in the past 24 hours. This notable decline has reduced investor and trader participation, significantly impacting market sentiment and resulting in a 35% drop in trading volume.

This drop in trading volume aligns with the price decline, suggesting that the ongoing downward momentum is weak and the price could see an upward move or reversal if sentiment shifts or buying pressure increases.

Expert Mixed Sentiment for Pi Coin

Amid the ongoing price fluctuations, several posts have surfaced on X (formerly Twitter), with some expressing an optimistic view, while others still see the drop as a cause for concern.

Recently, a crypto expert shared a post on X, stating, “From $0.64 to $0.58 in just 2 hours. I just hope this is the last dump by the market makers before they pump PI in the next few days. But if there’s no good news on the 28th, we’re f*cked.”

Given the current market sentiment, another expert shared a post on X, stating that with the recent dip, the next explosion is being prepared for Pi crypto, and it still holds the potential for a massive surge.

Meanwhile, some voices in the community emphasize long-term growth, saying, “It’s not crashing, it’s expanding. Behind the scenes, the network is growing, the ecosystem is evolving, and Pi is doing its own thing — totally different from the usual crypto copycats.”

They also noted that this isn’t just some random market joke; Pi is simply leveling up.

PIUSDT Daily Chart
PIUSDT Daily Chart | Source: TradingView

According to expert technical analysis, following the notable price decline in recent days, Pi crypto appears to be standing at a make-or-break level.

This dip occurred after the asset hit a strong resistance at $0.66 and the 50-day Exponential Moving Average (EMA) on the daily timeframe.

Pi Crypto Value: Will Price Reclaim $1.25?

Based on recent price action, if the current market sentiment remains unchanged and the price continues to decline, falling below the key support level of $0.515, there is a strong possibility that the asset could experience a significant drop, potentially reaching the $0.40 level in the near future.

On the other hand, if the sentiment shifts and the price of Pi crypto soars again, breaking out of the key resistance level at $0.66, there is a strong possibility that the asset could reverse its prolonged bearish trend and potentially reach the $1.25 level in the future.

At press time, Pi crypto value is trading below the 50-day Exponential Moving Average (EMA), indicating a prevailing bearish sentiment and suggesting that the asset may continue to face downward pressure unless a strong reversal occurs.

Whereas, the Relative Strength Index (RSI) stands at 44.89, indicating that the asset is currently in a neutral zone but edging closer to the oversold territory, which could hint at a potential buying opportunity if selling pressure persists.

Massive Sell-Off In AI Crypto Coins: TAO, NEAR, & RENDER Under Pressure

0

Key Insights:

  • AI crypto coins are among the hardest hit, with top assets like TAO, NEAR, and RENDER continuing to bleed and forming bearish patterns.
  • Amid this market uncertainty, investors are steadily dumping these leading AI crypto coins.

Amid the ongoing market uncertainty, AI crypto coins have been hit the hardest, recording a notable decline in their value.

Data from CoinMarketCap shows that major AI crypto coins, including Bittensor (TAO), Near Protocol (NEAR), Render (RENDER), and Artificial Superintelligence Alliance (FET), have lost 26%, 23%, 35%, and 25% of their value over the past month.

Ai Crypto Coins
Ai Crypto Coins | Source: CoinMarketCap

The potential reasons behind this significant drop in AI crypto coins are the ongoing geopolitical tensions between Israel and Iran, as well as recent tariff policies.

Ai Crypto Coins Continue to Bleed

However, these are not the only tokens that have been witnessing a price decline. Top assets like Bitcoin (BTC), Ethereum (ETH), and Solana (SOL) have also recorded notable price drops. The current market structure appears weak, as the prices of TAO, NEAR, RENDER, and FET seem to be continuing their downward trend.

To see where AI crypto coins is headed in the coming days, let’s explore it thoroughly.

TAO Current Price Momentum and Upcoming Levels

TAO, the native token of Bittensor, is currently trading near $325 and has lost 4.25% of its value in the past 24 hours. During the same period, participation from traders and investors plummeted, leading to a notable 15% drop in trading volume compared to the previous day.

Given the current market structure and overall sentiment, investors and long-term holders appear to be dumping their holdings, as reported by the on-chain analytics firm Coinglass.

Data from spot inflow/outflow reveals that exchanges across the crypto landscape have recorded an inflow of $5.55 million worth of TAO in the past week.

TAO Spot Inflow/Outflow
TAO Spot Inflow/Outflow | Source: CoinGlass

This notable inflow of TAO suggests potential dumping, which could help the asset continue its downward momentum in the coming days.

According to expert technical analysis, TAO appears bearish as it has successfully retested the breakdown of the key support level at $340 and has formed a bearish engulfing candlestick pattern. The formation of this candlestick at the resistance level signals a bearish trend.

TAOUSDT Daily Chart
TAOUSDT Daily Chart | Source: TradingView

Based on recent price action, if TAO fails to regain the $340 level, there is a strong possibility that the price could drop by 35% and reach the $208 level in the near future.

When combining these metrics with technical analysis and current market sentiment, it appears that TAO is bearish and may continue its downward momentum, which could influence other AI crypto coins.

NEAR and RENDER Appears Bearish May Continue Price Dip

Looking at NEAR, it is currently trading near $2.13 and has lost over 2.45% of its value in the past 24 hours. With this drop, NEAR appears to be struggling at a strong resistance level and has formed a bearish harami candlestick pattern, which suggests a potential price decline in the coming days.

The same has also been observed in RENDER, which has lost 5.12% of its value in the past 24 hours and is trading near $3.09. With this notable drop, it has formed a doji candle at the resistance level of $3.10 and appears to be forming an evening star candlestick pattern, which suggests that the downside momentum could continue in the coming days.

Considering the notable price drops over the past 24 hours and in recent days, investors and long-term holders appear to be continuously dumping their NEAR and RENDER holdings, as reported by Coinglass.

Data reveals that exchanges have recorded an inflow of $593K and $741K worth of NEAR and RENDER tokens, respectively, in the past 24 hours, suggesting a potential sell-off and signaling a bearish outlook for investors and the overall AI crypto sector.

XLM Crypto Price Dips, Yet Traders Build Long Positions, What’s Next?

0

Key Insights:

  • XLM crypto price could continue its downside momentum and may drop to the $0.22 level in the coming days.
  • XLM’s downside momentum could only end if it breaks out of the descending channel pattern; otherwise, the price may continue to struggle.

Amid the ongoing geopolitical tension, XLM crypto price appears to be continuing its prolonged bearish trend following the formation of a bearish price action pattern. The daily chart reveals that the asset has been moving within a descending channel pattern since May 2025, fluctuating between its upper and lower boundaries.

Current Price Momentum

At press time, the XLM crypto price was trading near $0.236, having lost over 3.10% in value over the past 24 hours. Meanwhile, during this period, participation from traders and investors also declined, leading to a 7% drop in trading volume compared to the previous day.

This drop in the trading volume, along with the price decline, hints at weakening investor confidence and the possibility of further downside in the near term. Additionally, it also shows weak downside momentum of the asset.

XLM Price Action and Key Technical Levels

According to expert technical analysis, XLM appears bearish and is poised to continue its downside momentum due to its bearish price action pattern. On the daily chart, the asset has been hovering within a channel pattern between the upper and lower boundaries.

However, XLM’s price recently soared following the ceasefire announcement between Israel and Iran, but it seems to have failed to sustain the momentum and now appears to be heading toward the lower boundary.

XLMUSDT Daily Chart
XLMUSDT Daily Chart | Source: TradingView

Based on recent price action, if the sentiment remains unchanged and the price continues to fall, there is a strong possibility that XLM could experience a modest drop of 7%, potentially reaching the key support level of $0.22, a level last seen during the previous market crash.

On the other hand, if the sentiment shifts and XLM ends its bearish streak and continues to rise, it could see a 10% price surge and reach the upper boundary of the channel pattern.

At press time, XLM crypto price is trading below the 50-day Exponential Moving Average (EMA) on a daily time frame, indicating an overall bearish trend and potential continuation of downward momentum.

This suggests that sellers remain in control, and unless the price reclaims this key moving average as support, the asset may struggle to attract bullish interest or initiate a sustainable recovery.

Whereas, the asset’s Relative Strength Index (RSI) stands at 37, indicating that it is approaching the oversold territory, which could signal weakening selling pressure and a potential for a short-term bounce or consolidation if buyers step in.

Bullish On-Chain Metrics

Given the current market sentiment, it appears that investors and traders hold a bullish view, as they seem to be accumulating and betting on long positions, according to on-chain analytics data from CoinGlass.

Data from spot inflow/outflow reveals that exchanges across the crypto landscape have recorded an outflow of $2.50 million worth of XLM tokens in the past 48 hours. This substantial outflow of XLM hints at potential accumulation by investors amid the price dip.

XLM Spot Inflow/Outflow
XLM Spot Inflow/Outflow | Source: CoinGlass

Additionally, it may reduce selling pressure and increase buyer interest, which could help XLM’s price rise if market sentiment shifts.

Meanwhile, on-chain metrics reveal that traders betting on long positions significantly outnumber those on short positions. At press time, traders are over-leveraged at $0.2313 on the lower side (support) and $0.2406 on the upper side (resistance).

These levels appear to be key zones, acting as strong support and resistance, where traders have built $1.35 million worth of long positions and $642,000 worth of short positions over the past 24 hours.

XLM Exchange Liquidation Map
XLM Exchange Liquidation Map | Source: CoinGlass

When combining these on-chain metrics, it appears that the bulls are currently dominating and seizing the dip as an opportunity to follow a buy-the-dip strategy.

Notcoin Price Rally Imminent? Support, Accumulation, & 3% Token Burn

0

Key Insights:

  • Notcoin price could soar by 100% if it holds above the $0.00168 support level.
  • Additionally, Notcoin has reduced its circulating supply by 3%, which appears to be another bullish catalyst for the asset.

Telegram-linked Notcoin price has plummeted significantly over the past few weeks and has now reached a crucial support level at $0.001680.

The daily chart reveals that this level has previously acted as strong support and could trigger a potential price reversal.

Notcoin (NOT) Current Price Momentum

Historically, since the launch of the NOT token, the price has reached this level nearly three times, and each time it recorded a reversal, raising hopes for a potential rebound this time as well.

At press time, the Notcoin price was struggling to gain momentum and is currently trading near $0.0018, reflecting a modest decline of 0.26% in the past 24 hours.

During the same period, investor and trader participation has also decreased, leading to a 7% drop in recorded trading volume.

This drop in trading volume, along with the price decline, suggests weak downside momentum, which could soon shift if buying pressure increases or if the bulls become active.

Are Investors Buying Notcoin?

Given the current market sentiment, investors and traders appear to be seizing the dip, as they have been observed strongly accumulating and betting on long positions, according to the on-chain analytics tool CoinGlass.

Data from the on-chain metric Spot Inflow/Outflow reveals that exchanges across the crypto landscape have recorded an outflow of $981K worth of NOT tokens.

This substantial outflow, recorded over the past week, indicates growing investor interest and suggests potential accumulation, which could increase buying pressure and further reduce selling pressure in the coming days.

NOT Spot Inflow/Outflow
NOT Spot Inflow/Outflow | Source: CoinGlass

In addition to investors, traders also seem to be following the same trend, as they are over-leveraged at $0.00173 on the lower side (support) and $0.00185 on the upper side (resistance).

At these levels, traders have built $494K worth of long positions and $309K worth of short positions, clearly indicating that long positions are dominating.

NOT Exchange Liquidation Map
NOT Exchange Liquidation Map | Source: CoinGlass

When combining these metrics, it appears that the bulls are back and are starting to push the asset’s price to higher levels.

Notcoin Price Action and Key Technical Levels

According to expert technical analysis, Notcoin has been trading within a descending channel pattern between the lower and upper boundaries for the past one and a half months. With the recent price dip, the asset has now reached the lower boundary of the pattern and a key support level at $0.00168.

The daily chart reveals that this level has a strong history of price reversals, and whenever Notcoin’s price has reached this level, it has shown upside momentum, something experts are currently anticipating.

Based on recent price action and historical patterns, if sentiment shifts and Notcoin’s price holds above the key support level, there is a strong possibility that the asset could experience a price reversal and may see a price jump of 100% in the future.

On the other hand, if Notcoin’s price falls below the key support level, it could pave the way for a significant price drop, and a new low may be witnessed in the near future.

NOTUSDT Daily Chart
NOTUSDT Daily Chart | Source: TradingView

In addition to the daily chart analysis, on the weekly timeframe, the asset appears to be forming a bullish double-bottom pattern. A bullish divergence is also visible on the weekly chart, suggesting a potential price reversal in the coming days.

Notcoin Price Analysis on Weekly Chart
Notcoin Price Analysis on Weekly Chart | Source: TradingView

In addition to these bullish developments by investors and recent price action, Notcoin recently made a post on X (formerly Twitter) that garnered significant attention from the crypto community. In the post, Notcoin stated, “NOT circulating supply has been reduced by 3% after a recent unintended burn, jfyi.”

This 3% reduction in circulating supply could help propel the asset once market sentiment improves.

Syrup Shows Explosive Growth & Market Dominance In Current Crypto Bubble

0

Key Insights:

  • Syrup leads the crypto bubble with an impressive 305% performance.
  • The protocol’s $2.5B TVL shows its increasing growth and stability.
  • Syrup’s rise highlights the shift towards yield-generating DeFi protocols.

Major DeFi protocols, such as Syrup, have managed to experience a fantastic growth, leaving a signature of its own in the crypto bubble. As its price and total value locked (TVL) boomed, Syrup has become an evident powerhouse of the decentralized finance sphere.

These great statistics of the protocol show that it is well-performing and has a chance to become a leader on the market as we progress to the altcoin season.

A Surge in the Crypto Bubble

The price of Syrup reached all-time high (ATH) and it is a considerable addition to the current crypto bubble. The feat is supported by significant milestones, such as a second $100 million deposit and a TVL of $2.5 billion.

Syrup is also expected to record the highest monthly volume of revenue ever in its history thus consolidating its position as one of the major actors within the DeFi market.

Syrup is among the most prominent performers in the context of the crypto bubble, with a daily rise of 18.7%. SPX (+7.9%) and PI (+16.2%) are also among the other assets with impressive increase, yet, Syrup is growing particularly impressive considering that it has a solid base and fast-growing audience.

This trend of the crypto bubble indicates a market that is experiencing an increase in assets and Syrup has been leading such an upsurge.

CryptoBubble Snap
CryptoBubble Snap | Source: CryptoBubbles

This remarkable performance of Syrup is worthy of mention but what is more important is that the inflated crypto bubble is still broadly growing, as altcoins are becoming more popular. The CMC Altcoin Season Index provides a scale of 0-100 with 0 indicating that we are still early in terms of the Bitcoin season as we only have 18/100.

Nonetheless, Syrup has already demonstrated itself as an outstanding asset with a stellar 305% showing in the last 90 days. With this performance it makes Syrup coin to be on top of the best 100 coin in the market and the altcoin season has not yet started.

The 90-day chart tracking the performance definitely shows that Syrup was dominating the crypto bubble. It is vastly beating its rivals, such as the altcoins like HYPE (+166%), and SPX (+121%), proving that the development of Syrup is not a temporary phenomenon, but a tendency.

This is reflective of Syrup as the currency also keeps rising indicating that it has even more to offer when the altcoin season really kicks off.

Snap
Snap | Source: X

Real Yield and Sustainable Growth

The rise of Syrup is not only to take advantage of the speculative nature of the crypto bubble but it is underpinned by actual yield, good infrastructure and definite growth opportunities.

With additional capital entering Syrup, we can see that its TVL is also increasing, proving that users and investors are getting more optimistic in the capacities of the protocol to make profits.

Such tendency to change towards yield-generating assets is typical of the new environment in the crypto bubble where sustainability of growth becomes one of the priorities of investors.

When it comes to the monthly protocol income, Syrup may be on the verge of having the largest income to date. The second deposit of 100 million dollars is another indication of how Syrup is scaling up and becoming increasingly liquid.

Syrup is also gaining popularity and funds by the day, which makes its leadership in the crypto bubble impossible to deny.

According to a TVL growth chart of Syrup, one can only observe that the protocol is growing fast, with revenues jumping through the roof in recent months.

This chart, combined with the crypto bubble indicators, points to the movement of Syrup that reflects what happens in the DeFi market in general, where protocols with real yields and novel infrastructures are experiencing a rapid TVL expansion.

The fact that syrup has dominated the crypto bubble is a clear testimony that the protocol is very strong and has more potential to grow. Having an ATH price, and TVL of $2.5 billion with an on-target revenue, Syrup can dominate the DeFi ecosystem as the alternative coin season unfolds.

Snap
Snap | Source: X

With the general crypto bubble constantly expanding, Syrup remains among the most thrilling assets to observe within the following months.

SUI ETF Filing Boosts Market Activity As DeFi Volume Hits $13.5B, DEX Trading Surges 168%

0

Key Insights:

  • The SUI ETF filing signals institutional interest in Sui’s growth.
  • Sui’s DeFi volume surged, reaching $13.5 billion in 30 days.
  • Approval of the SUI ETF could drive institutional capital into Sui.

Sui might be making headways towards traditional financial (TradFi) markets with the recent SUI ETF filing by 21Shares with Nasdaq. With its ongoing development, the volumes of DeFi trading transactions and the development of the platform, Sui could be setting up for a bullish long-term.

The SUI ETF Filing: A Game Changer for Sui

This ETF filed on the 23rd of May 2025 by the SEC tracks the performance of the Sui token. In case of its approval, such an ETF will provide traditional investors with access to Sui without the necessity to purchase and store its token itself and expand its applicability and reach.

The SEC examination will last no more than 240 days after which a decision will be made, and it is projected to be made on January 18, 2026. Such an approval would put Sui in a small pool of altcoins that have an ETF and could provide a serious boost to the market.

On one hand, the filing of the SUI ETF attracts spotlight, and on the other hand, the Sui blockchain also experiences roaring success in the DeFi segment.

The trading volume of decentralized exchanges (DEXs) on Sui has been incredible — total trading of 13.5 billion over the previous 30 days — indicating an increasing appetite by traders on the Sui ecosystem. This amount of trading growth shows the growing interest in Sui decentralized applications. This may continue to grow with the release of the SUI ETF.

SUI
Snap | Source: X

Moreover, the decentralized lending protocol of Sui, SuiLend, also saw a tremendous increase in Total Value Locked (TVL). Within a month, the TVL on SuiLend soared to a whopping half a billion dollars, where a major indicator of the increased liquidity and the intensity of interest among investors are considered.

These DeFi applications have also performed strongly, hence making Sui quite an appealing token, which will certainly blossom further, particularly when the SUI ETF is launched.

Sui’s On-Chain Activity Thriving Amid SUI ETF Anticipation

The rise in the momentum of Sui is also observed in on-chain activity data. The figure of daily active addresses shows that the increase in active users at the end of March and at the beginning of April 2025 was short-lived, as the network was rocked by a 75.3 percent decline in active users by mid-June.

Even though this decline was significant, the number is not too low at 321,000 active addresses currently, so as long as user activity may be subject to changes, Sui still maintains a strong user base.

Daily Active Addresses Chart
Daily Active Addresses Chart | Source: Artemis

In comparison, the chart on DEX volume provided by Sui indicates a significant growth in trading activities, where the total amount based on the volume it had in the last month reaches $356.1 million.

This is a 168 percent increase in DEX volumes, which means that although active users might be tending to concentrate, more trading activity is being recorded by people who are staying active.

DEX Volumes Chart
DEX Volumes Chart | Source: Artemis

The separation between the number of active traders and the trading volume alludes to the fact that there are fewer active traders who actively execute deals during Sui decentralized exchanges.

Such a strategy can become one of the main driving factors of the further rise of the token, in case the SUI ETF will assist in attracting additional institutional attention.

SUI ETF submission is also made when the token is going through a barren price trend. The SUI ETF may however be a major catalyst of changing this trend to see institutional money flowing into the ETF which may see prices increase.

With the SUI ETF being already in motion of the SEC approval, there are opportunities to see the growth of the token to a wider audience interested in an approved cryptocurrency investment instrument.

The existing support of Sui at $2.63-2.80 as seen in the quoted tweet above succeeded in staying. The token touched this area several times when it dipped.

Lastly, the reclamation of this important zone of support would precede a price rally, especially when the SUI ETF is approved and there is an influx of institutional investors.

XLM Crypto Price Holds Key Support As Analysts Target $6.50 In Bullish Setups

0

Key Insights:

  • XLM crypto price is forming a five-wave impulse from $0.23, targeting a macro top near $6.50.
  • The 0.786 Fibonacci level and falling wedge pattern suggest a breakout may lead to $0.4584–$0.6719.
  • Support at $0.20 remains intact; invalidation only occurs with a weekly close below this demand zone.

Stellar (XLM) crypto price showed preliminary indicators of recovery in the short-term, mid-term, and long-term timeframes. Technical analysts highlighted a bullish formation in momentum as well as structure.

Meanwhile, XLM crypto price movement has placed the altcoin near several high-confluence support zones. Further, the analysts suggested that the trend could develop into a broader reversal phase if key levels hold and volume supports follow.

XLM Crypto Price Build Long-Term Structure Toward $6.50

According to analyst CaptToblerone, XLM crypto price has completed a corrective ABC pattern on the 3-day chart. The conclusion of wave (B) near the $0.16–$0.18 support level signaled the start of a new five-wave impulse.

Stellar Crypto Price Chart
Stellar Crypto Price Chart, Source: X

Wave (1) is developing, and wave (2) is also expected to retrace into the blue trendline. This has in the past served as a point of support and justifies its application in the current installation.

Furthermore, Fibonacci and regression channels drawn by the analyst indicated the structure of a breakout with points of resistance at $0.65, $1.60, and $4.20. An upper target of the wave formation is calculated to reach the mark of $6.50, where wave (5) of the multi-year bullish trend will be found.

More so, it indicated the potential for an over 2,700% increase in Stellar crypto price relative to positioning in the event that Elliott Wave roadmap plays out as projected. The pattern comprises structural wave transitions and high-precision regression tools.

Analysts Point Out Base as XLM Crypto Price Holds Support

Additionally, analyst VipRoseTr made a weekly analysis, which revealed a descending wedge profile. XLM crypto price recently touched the score of 0.786 Fibonacci, which is considered an important confluence point that leads to trending reversals.

Subsequently, XLM crypto price has held above a clearly defined demand zone around $0.20, suggesting that downside pressure may be weakening. A sustained weekly close above the wedge resistance could confirm the bullish reversal setup.

XLM Crypto Price Chart
XLM Crypto Price Chart, Source: X

According to the analyst, projected Fibonacci-based targets include $0.4584, $0.5610, and $0.6719. Each of these aligns with historical resistance points from previous consolidation cycles in Stellar coin trading history.

Besides, the falling wedge is considered valid unless XLM crypto price closes below $0.20 on the weekly chart. As long as demand zone remains intact, the analyst pointed to medium-term upside continuation.

XLM Crypto Price Signal Bullish Momentum Continuation

Moreover, the most recent analysis identified a bullish MACD crossover, whereby the MACD line (0.0027) moved above the signal line (0.00003). The growing histogram portrayed the growth of purchasing momentum in the short term.

In addition to that, this crossover follows XLM crypto price surge from $0.22 to around $0.2479. Also, technical formation confirmed that short-term market sentiment is shifting toward bullish control.

XLM Crypto Price Chart
XLM Crypto Price Chart, Source: TradingView

On the other hand, XLM crypto price broke above the mid-band of the Bollinger Bands at $0.2365. While pressing against the upper band at $0.2522.

Consequently, this push into the upper volatility channel suggested overextension but also indicated trend continuation if the resistance is broken. Immediate resistance remained at $0.2522, with extension expected near $0.26.

Therefore, if a pullback takes place, support will emerge around $0.2365 and $0.2280. This short-term structure contributes to the broader bullish case for Stellar crypto price.

While risk remained in the event of invalidation at key support zones, structural signals favor a medium to long-term bullish phase for XLM crypto price prediction. Stellar coin investors face a high-confluence technical setup supported by multiple indicators.

Additionally, Stellar crypto price is currently trading around $0.24. When placed within the broader market structure, XLM stands out among the altcoins, showing early reversal strength.

SEI Crypto Surges 47%: Will The Breakout Extend To $1.10 & Beyond?

0

Key Insights:

  • SEI crypto surges 47.73% from $0.185 as breakout confirms second leg of rally since May.
  • Donald Trump tweet fuels $10 speculation, driving viral community engagement.
  • $2.7M net inflow in 24h ranks SEI among the top 3 chains, showing organic network growth.

Sei Crypto Breaks Out With 47% Rally From Support

Sei crypto has surged over 47% following a breakout from consolidation, marking its strongest rally in months. This was followed by SEI retesting important levels that caused a break of a potential descending trendline, and the result was renewed bullishness.

Analyst World Of Charts found that this had been setting up since early-May and was done with a high-risk/reward ratio, yielding a 45%+ profit off the breakout base.

SEI Price charts
Source: World Of Charts, X

SEI crypto experienced a 0.0892 USDT value gain above its $0.185 base over a 12H Binance chart, an equivalent in power to its earlier 56.64% rally observed during the earlier day of April.

The pattern suggests consistent behavior in SEI’s upward moves after accumulation phases. The price is trading above $0.265, and short-term resistance is around $0.30 and $0.35.

The price action combined with volume spikes and the clearance of the trendlines indicates the possibility of subsequent upside. Support is currently at about $0.22, which is an area of earlier rejections that then turned to support.

10 Projection Goes Viral Amid Community Speculation

Market speculation further increased when a viral tweet by U.S. President Donald Trump said, SEI will go to $10. The tweet received more than 65 million views and 12,600 likes. Though perhaps speculative, and most certainly rhetorical, the message appealed to many retail traders.

The post is not available on X, also, Trump has been regularly active on Truth Social, instead of X. Whether Trump actually made that post remains unconfirmed.

$SEI is going to $10
Source: Ryuzaki SEI, X

Sei supporters, such as Ryuzaki SEI, responded to this call and created temporary hype. There is no technical argument that could justify a $10 valuation at this point, however, these viral moments tend to affect liquidity and sentiment.

As is evident with what has happened with other assets historically, community-driven force can sometimes temporarily push prices above fair value. But institutional traders, on average, do not trade entirely on social signals.

The laying price of under $0.30 means that the $10 target is very much aspirational, but the wave of social interest is helping support growing volumes and market interest.

Daily Chart Indicates Bullish Trend Shift

The broader technical picture for Sei crypto shows signs of a long-term reversal. In chart analysis, Crypto Yoddha revealed a breakout of descending triangle formation in the daily scale.

This structure had restrained SEI gain since March however, recent movement of prices breached the upper resistance.

SEI Price charts
Source: Crypto Yoddha, X

A series of higher lows, as well as the formation of a bullish channel, was evident on the chart. Provided that the price is above the breakout area, then analysts expect additional increases towards the $ 0.50 area.

The earlier bearish trend marked late 2024 has now been broken, and the new arrangement indicates a potential medium-term range of approximately $0.75 to $1.10.

Not only was the breakout formed with an increasing volume, but the trader’s interest in the new direction of the trend was confirmed too. A retest area would be down to the $0.21-$0.22, and a bounce might indicate a continuation.

$2.7M Net Inflow Underscores Growing Network Activity

On-chain data supports the recent price strength. According to Artemis metrics shared by Alex Kosa, Sei crypto recorded a net inflow of $2.7 million over a 24-hour period. The network ranked third after Ethereum and Base among the best chains.

SEI Price
Source: Artemis Data

Having inflows of $3.1 million compared to outflows of just $367K, SEI performed better than networks like Arbitrum, StarkNet, and Bitcoin. Netflow value is the actual use of a network or consistent demand instead of short-term speculation.

According to analysts, such inflows show a growing confidence in the builders and consumers. An increase in netflow is also likely to sustain price growth because it depicts real liquidity and utilization on-chain.

The data highlighted Sei crypto growing role within the DeFi and Layer 1 ecosystem, as developers and users shift activity toward more scalable platforms.

XRP Price Eyes Breakout Above $2.60 as Korean Demand Surges

0

Key Insights:

  • The XRP has experienced a robust bounce off the support area of $1.85 and 1.90 in favor of the rally up to 2.18 upon the increase of its volume.
  • Upbit exchange was an attraction in South Korea with a 24hr trading volume of $20.96 billion, where XRP contributed 15.96% to the total KRW trading going on in the exchange.
  • XRP retail was also bullish in sentiment as was institutional.

Upbit exchange was a prime attraction point in South Korea with a staggering 24-hour trading volume of $20.96 billion.

XRP news noted Ripple’s XRP contributed 15.96% to the total KRW trading going on in Upbit exchange.

XRP News on Price Analysis

Technically, XRP experienced a robust bounce off the support area of $1.85 and $1.90 in favor of the rally up to $2.18 upon the increase of its volume. The price regained the $2.00 psychological level and proved the upward pace.

According to the chart, the first resistance and big sell wall was pegged at $2.40 after which a bigger sell wall was found in the region of $$2.60.

Should XRP manage to break above the resistance at $2.40 with powerful volume, then it may jump in price to approach the resistance area at $2.60 soon enough.

A break above $2.60 would then create space to $2.70 and above. Failure to break and hold over $2.40 may however result in its rejection and a pull-back.

XRP price chart
XRP price chart | Source :X

Under this condition, XRP may have its second glance at the price of $2.00 and drop into the region of support at $1.90.

Another breakdown may take the route back to the earlier area of accumulation plains around $1.70-$1.85.

An increase of volume in the recent up-trend justified the existing bullish price effect; however, more pressure in the price zone well beyond the $2.40 would be substantial to verify it.

As long as XRP was hovering above the 2.00 mark, this trend was in a bullish mood and the support flow was ever increasing.

XRP News: Could Korean Demand Bring Interest On XRP?

The surge in Upbit caused XRP as a trading pair to be the most dominant one at the top exchange in Korea, which served as a symbol of increased investor appetite and new strength among the tokens.

That was a huge portion of market activity, which suggested intense retail, and even institutional involvement.

Flare-up in the Korean demand may bring subsequent interest in XRP globally, which may move XRP to critical resistance levels when other volumes warrant.

Nevertheless, a temporary decline may ensue in case buying pressure expires or in the event there is a wider change of mood in the markets.

South Korea has always dictated altcoin rallies and the ruling of XRP in the South Korean currency (KRW) further supplements its status of a speculative and strategic asset.

Provided this tendency continues, XRP may become the primary driver of the next Altcoin rally that should be region-based, and the volatility will likely stay high in the near future.

XRP Crowd Vs Smart Money Sentiment

Meanwhile, XRP retail was also bullish in sentiment as was institutional. Crowd sentiment was at 0.10, indicating just positive, whereas the sentiment of smart money was much higher at 1.40. This meant recognizable institutional optimism.

The split indicated that although interest levels were generally mild in retail investors, professional investors had been turning more upbeat.

XRP crowd vs smart money chart
XRP crowd vs smart money chart | Source: X

Such sentiment compatibility corresponded to further encouragement of rising prices. Had retail sentiment become better, then a more intense rally would have ensued due to wider participation.

But in case the sentiment behind smart money was not so hot, the momentum could have been weak even though the people were optimistic.

Its two-bears reading indicated a positive posture, and it could be that smart money was expecting the market to behave well or be well-founded.

The presence of accumulation behavior in XRP was alluded to by the current positioning, particularly before possible breakout regions were to be seen.

Ondo Finance Rides Tokenized Treasuries Surge as $ONDO Forms Bullish Reversal Setup

0

Key Insights:

  • Tokenized US Treasuries have grown from $4B to over $7B in 2025.
  • Ondo Finance is a leading provider of tokenized yield products.
  • Despite a bullish chart pattern forming for $ONDO, on-chain metrics remain bearish.

Ondo crypto is gaining momentum as tokenized real-world assets continue to expand in on-chain finance. As of June 2025, total value locked (TVL) in tokenized U.S. Treasuries surpassed $7 billion, up from $4 billion at the start of the year. The surge underscores increasing investor interest in blockchain-based exposure to traditional financial instruments.

Ondo Finance, the firm behind Ondo crypto, has emerged as a key player in this space. The company provides institutional-grade yield through tokenized products such as OUSG and USDY. These offerings allow global investors to access U.S. Treasuries using stablecoins, reducing reliance on traditional financial intermediaries.

Ondo Crypto Price Action Signals Potential Reversal Amid Thriving Ecosystem

The indigenous token of Ondo Finance, Ondo crypto ($ONDO), was trading at 0.6825 as of press time, a 5.01% growth within 24 hours. This surge in value is duplicating the growing optimism over real-world asset tokenization.

The prices of ONDO/USDT actively form the falling wedge structure on the daily chart. This is usually considered a bullish reversal formation. The wedge takes place between a local high at around 2.01 and a recent low at slightly below 0.68. The narrowing structure began to develop in December 2024, and the recent price action shows there might be a breakout attempt in progress.

Provided that it is confirmed, the breakout may suggest the target movement to the area of $1.20-1.60, which is defined by the height of the wedge figure. Yet, the present resistance is roughly at $0.75, and the confirmation of the price above this amount is required to continue movement.

The Money Flow Index (MFI) is currently oversold at 32.78, although increased buying participation has yet to confirm this. At the same time, the volume delta analysis indicates an abrupt rise in purchase pressure recently, with net positive volume of about 879.39K on the last day of trading. However, this is not sufficient to maintain a very sharp breakout.

1-day ONDO/USDT Chart |
1-day ONDO/USDT Chart | Source: TradingView

On-Chain Metrics Point to Bearish Bias Despite Ondo Crypto Price Recovery

The on-chain reality suggests that the mood is relatively sober despite the short-term relief rally. On-chain analysis shows that only 6% of the owners are already in profit, and 91% are still out of the money. This indicates that most investors have yet to break even, and this may inhibit any aggressive upside in the near future.

Moreover, Telegram’s growth decreased by 0.24% in the previous week, indicating a minor inactivity of the communities. The level of concentration is high, and large wallets control 87% of the supply. On the one hand, this may mean significant long-term holders. It also focuses power in a small circle of actors.

ONDO Crypto Data
ONDO Crypto Data | Source: IntoTheBlock

The global demographics of transactions are virtually balanced, with 54% coming from the West and 46% coming from the East. The transaction volume was 191.64 million dollars in the last seven days. The market signals are still bearish. The general signal chart describes three bearish signals and only one neutral signal. In particular, there is a network growth of 113%.

The concentration metric has declined by 0.02%, and big trading is down by 3.87%, both of which indicate a bearish condition. These numbers indicate a decrease in interest on the protocol level, although price is trying to achieve a technical recovery.

The short-term bearish technicals and on-chain evidence contradict the overall strategic trend of tokenizing real-world assets in Ondo crypto. As an exponentially growing number of institutions move their assets onto blockchain-based asset rails, Ondo crypto is poised to lock more and more in tokenized treasuries and enjoy global interest in compliant, yield-bearing digital products in general.

BlackRock Stock Eyes on Breakout, BLK Major Rally Imminent?

0

Key Insights:

  • BlackRock stock could see a price surge of over 8% to 10% if it breaks out of prolonged consolidation and the key resistance level.
  • Given the current market sentiment, it appears that BlackRock is on a buying spree.

For over a month, BlackRock stock (BLK) has been moving sideways and consolidating within a tight range. This ongoing consolidation appears to be potentially driven by geopolitical tensions between Israel and Iran, as well as recent tariff policies.

Market Sentiment and Price Momentum

These developments not only impact overall market sentiment but also negatively affect the entire financial market, including crypto, stocks, and commodities. Amid this, BlackRock stock (BLK) showed little reaction, instead consolidating and remaining sideways.

At press time, BlackRock stock (BLK) was trading near $986 and had registered a modest price surge of 1.22%. Meanwhile, the asset recorded a 0.51% gain over the past month and 23.45% over the past year.

BlackRock Stock Price Momentum
BlackRock Stock Price Momentum | Source: Google Finance

Given the current market sentiment, it appears that BlackRock is taking advantage of the market structure and significantly buying the dip.

BlackRock’s Deepening Interest in Crypto

Recently, several posts on X (formerly Twitter) by experts and on-chain analytics firms have surfaced, suggesting that BlackRock is significantly accumulating Bitcoin (BTC) and Ethereum (ETH) as their prices have dropped significantly from all-time high levels

A well-followed crypto analyst shared a post on X stating that BlackRock has purchased a substantial $750 million worth of Ethereum (ETH) so far in June 2025. This significant purchase by an industry giant suggests that the current market structure might present an ideal buying opportunity.

Meanwhile, a local news outlet shared a report noting that, with continuous Bitcoin accumulation, BlackRock now holds a substantial 3% of all Bitcoin, making it the largest institutional Bitcoin holder.

Looking at BlackRock’s actions in the crypto landscape, it appears they are buying as much Bitcoin and Ethereum as possible, something only a firm like BlackRock can afford to do.

Additionally, rumors have surfaced that BlackRock is pressuring the United States Securities and Exchange Commission (SEC) to approve XRP spot ETFs before July 2025.

BlackRock (BLK) Price Action and Key Technical Analysis

According to expert technical analysis, BlackRock stock (BLK) has been consolidating in a tight range for the past one and a half months near the key resistance level of $1,000. The daily chart reveals that the asset has a strong history of price reversals from this level.

As per the daily chart, since February 2025, BlackRock stock has experienced more than five price reversals from this resistance level.

BLK Daily Chart
BLK Daily Chart | Source: Trading View

Blackrock Stock Price Prediction

Based on recent price action and historical patterns, if BLK breaks out of the prolonged consolidation and the resistance level, and closes a daily candle above $1,006, it could pave the way for further upside momentum.

If this happens, there is a strong possibility that BlackRock stock could see a price surge of over 8% to 10%, potentially reaching the $1,100 to $1,110 levels in the coming days.

Technical Analysis: EMA and RSI Insights

At press time, BLK’s Relative Strength Index (RSI) stands at 61, indicating moderate bullish momentum and suggesting that the stock is approaching overbought territory but still has room for further upside.

Meanwhile, the asset price is trading above the 200 Exponential Moving Average (EMA) on the daily time frame, indicating a strong long-term bullish trend and reinforcing investor confidence in continued upward momentum.

“When combining all these factors — from rising interest among analysts to the company’s strong confidence in crypto — it appears that BlackRock stock could break out of the prolonged consolidation it has been experiencing over the past few months.

XRP Price Risks Drop to $1.72 If H&S Pattern Breaks Support: Details

0

Key Insights:

  • XRP price is trading around $2.00, and analysts are pointing to $1.81 and $1.72 should there be a breakdown in support.
  • BitGo CEO says RLUSD proves Ripple’s XRP bridge dream has failed.
  • The liquidity points at $1.87 and 1.72 indicate potential bottom areas

XRP price is struggling to hold above $2 as traders assess technical chart signals pointing to further downside. At the same time, Ripple’s recent launch of the RLUSD stablecoin has reignited conversations about XRP’s core utility. Analysts now caution a potential shift to $1.81, though new liquidity patterns and wave structures inform the anticipation of the next market development.

XRP Price Eyes $1.80 Neckline in H&S Formation

Market veteran Peter Brandt recently called attention to a potential Head-and-Shoulders (H&S) top forming on the XRP price chart. According to Brandt, the sharp move seen on April 7 may have been an “out-of-line movement,” and the pattern suggests that XRP price could be topping out unless support holds. The neckline, which is trading around $1.80, is a critical support.

xrp price chart
Source: Peter Brandt, X

Brandt explained that the chart is not necessarily bearish unless the $1.80 level breaks. Price is now at support, and he added that he will revise his outlook should the price close below the 1.8xxx range. His assessment underscores a growing caution among technical traders, especially as XRP  price continues to hover near key breakdown levels.

In case the H&S pattern is correct, it may indicate an end to the strong upward trend in recent weeks. A break at a price level below the neckline would signal more downside, and earlier support areas are at risk of becoming resistance areas. As such, XRP’s ability to remain above this zone may determine the short-term market bias.

Elliott Wave Structure Signals Drop To $1.81

Further bearish confirmation comes from analyst Man of Bitcoin, who sees XRP price completing a wave 4 rally and preparing for a final fifth wave down. His 4-hour chart suggests that XRP price has already hit major resistance and is now likely targeting the 100% Fibonacci extension near $1.81.

xrp usd
Source: Man of Bitcoin, X

The configuration showed future losses to $1.787, $1.709, and even towards $1.62 in case sellers take charge. The structure is textbook corrective by the wave count, with lower highs creating a declining wedge. This coincides with reduced volume and stalling RSI, which are indicators of declining bullish momentum.

Therefore, 0.618 retracement and Fibonacci confluence at this area make the area of $1.81 an important support target. To negate this scenario, XRP price will have to recover above the $2.11 level, rebounding beyond the short-term resistance and invalidating the formation of the fifth wave.

Liquidity Maps Highlight $1.87 and $1.72 Zones

To further add pressure, liquidity heatmaps on Cryptoinsightuk showed a heavy concentration of the price levels around $1.87 and $1.72, which can draw the price towards them. The 4-hour chart reveals a dense build-up of open orders below the current XRP price, suggesting market makers may drive the price down to fill those orders before any bounce.

xrp price
Source: Cryptoinsightuk, X

The analyst noted that if support holds, targeting liquidity around $1.87 would be reasonable. If the price drops to $1.72, it could present an ideal entry point. This aligns with Fibonacci and wave projections. It is important to note that the lack of liquidity above the current price, compared with high demand below, supports the likelihood of a downside sweep.

RLUSD Launch Fuels Questions About XRP’s Future

Amid the technical pressures on XRP price, fundamental doubts about its utility are reemerging. Speaking on the Digital Banking 2025 conference, BitGo CEO Mike Belshe lamented the new RLUSD stablecoin released by Ripple, citing it being a failure of the XRP bridge currency idea. “USD stablecoins are just better,” Belshe said, citing the inefficiencies in XRP’s two-step conversion process.

Ripple CTO David Schwartz responded by stating that XRP would continue to function as a bridge asset alongside RLUSD, not in competition with it. RLUSD has already gained traction, receiving approval from the Dubai Financial Services Authority (DFSA) and approaching a $500 million market cap.

US SEC Crypto ETF Approval Odds Hit 90% Amid Regulatory Shift

0

Key Insights:

  • US Securities and Exchange Commission (SEC) is expected to approve multiple crypto ETFs, including altcoins, by late 2025.
  • Over $1 billion in crypto ETF liquidations occurred as Bitcoin fell below $99K during weekend selloff
  • Ethereum ETFs saw sustained inflows in June, while Bitcoin ETF activity remained volatile.

Crypto ETFs in the United States have shifted decisively, and analysts have increased the chances of their approval to a significant percentage. This coincides with indications of positive interactions between SEC and major asset managers, making it more certain that large volumes of digital asset ETFs will be approved.

In addition, the developments follow surging demand for existing products such as Bitcoin ETFs and coincide with geopolitical concerns that have pressured the crypto market.

Analysts Raise Approval Odds for Major Altcoin Crypto ETFs

According to Bloomberg ETF analysts Eric Balchunas and James Seyffart, the U.S. SEC has shown positive engagement on pending crypto ETF applications. As a result, the analysts placed approval odds for several products at up to 95%.

Moreover, this expectation covers spot crypto ETFs for Solana (SOL), Litecoin (LTC), XRP, and Dogecoin (DOGE). The analysts suggest the SEC is likely to classify these assets as commodities, which would place them outside its securities jurisdiction.

While the analysts anticipate further progress, they noted that approvals may not materialise before October 2025. Seyffart stated that the timeline could stretch beyond this date, depending on procedural steps.

Crypto ETFs Regulatory Status and Application Tracker

A tracking table of current filings revealed extensive activity by large firms, including Grayscale, Bitwise, and Canary. These asset managers have filed S-1 and 19b-4 forms on different crypto ETFs that would cover altcoins such as Polkadot, HBAR, and Avalanche.

crypto etf
Source: X

Further, the SEC has acknowledged most filings, setting final decision deadlines between October and December 2025. Approval probabilities for these assets range from 90% to 95%, according to analysts. The basket or index product, which would package several digital assets into one fund, has a projected approval likelihood of 95%.

However, certain assets are subject to regulatory uncertainty. SUI has a 60% probability of approval with no clear classification as a security or a commodity. Tron (TRX) currency has no tie-in odds, and the decision is still pending until 2026, with SEC yet to provide guidance.

Bitcoin and Ethereum Crypto ETF Momentum and Market Volatility

BlackRock’s iShares Bitcoin Trust (IBIT) has surpassed $70 billion in assets under management within 341 days. IBIT is now the fastest-growing ETF in U.S. history, with 31 consecutive days of net inflows. By contrast, traditional ETFs like GLD and VOO took over 1,600 days to reach similar milestones. IBIT’s rise highlights institutional demand for regulated bitcoin exposure.

crypto
Source: X

Meanwhile, Ethereum ETFs show slower progress. Glassnode data revealed that most ETH crypto ETF holders remained underwater as of May 2025. Although inflows rose on June 10–11, price gains were modest. Broader crypto market volatility also spiked as Bitcoin fell below $99,000 amid geopolitical tensions.

According to CoinGlass report, over $1 billion in liquidations, with institutional ETF inflows slowed sharply heading into the weekend.

Crypto ETF Speculation Signals Altcoin Rotation

With increasing optimism about a potential XRP crypto ETF, analysts suggested the move may trigger more capital rotation into altcoins. An institutional endorsement would indicate that XRP and, by extension, the rest of the large-cap and mid-cap digital assets would have greater institutional legitimacy.

According to a report, this shift could mirror the capital flows seen after spot bitcoin ETF approvals earlier in the year.

One of the biggest winners of this narrative is Solana, which has recorded solid network performance and increased developer activity that has already gained new institutional interest.

Notably, crypto ETF market may soon no longer be limited to Bitcoin and Ethereum, should the current momentum with U.S regulators hold.

SEI Crypto Price Action Signals Potential Upside as Network Activity and Inflows Strengthen

0

Key Insights:

  • SEI price holds support, setting up for potential bullish continuation.
  • Net inflows of $2.7M reflect growing interest in SEI.
  • Technical patterns signal strength as traders eye a breakout above $0.29.

SEI crypto currently shows relative strength, with nothing to dispute its progression, both on-chain and price-wise. The SEI crypto traded at 0.202 as of press time, 4.22% up over 24 hours. The short-term momentum has been gathering above the key $0.1850 zone. The latest technical observations support this support level as necessary to verify additional upsides. The price remaining above this zone will open the route to the resistance area of $0.30-$0.32, and the $0.2917 level will be a critical trend reversal signal.

The catalyst candle chart shows how SEI gained back the $0.1874 area after a retest and bearish wick. The breakout volume of this zone is massive, which makes it more significant to the structure. In the case of buyer control in the case of nullification of all low-high patterns, the following central sphere of attention could be taken as being close to $0.2917. This is where the local supply zone existed at the end of May. This price is also in line with the previous rejection of price, and it may serve as the next liquidity level.

12-hour SEI/USDT Chart
12-hour SEI/USDT Chart | Source: X

Bullish Structure Confirmed by Technical Patterns

More bullish momentum can be confirmed on the daily chart, which indicates a completed inverse head and shoulders. A neckline breakout value of about 0.12 to a breakout of about 0.20 gives a projected target of about 0.40 or better to 0.30. It is backed by a falling wedge breakout that had merged with the right shoulder. This showed that there was remarkable confluence towards a bigger move on the upside.

Momentum indicators in the daily time frame can support this breakout story. The Relative Strength Index, or RSI, stood at 54.18, which is not overbought and not oversold, so it has further chances to move up. In the meantime, the crossover of Stochastic RSI above 65 signals the presence of upward pressure. The primary resistance levels now are at $0.25 and $0.30, and the strong supports are at $0.1850 and $0.1722 marks. The area is where the time frame breakout started at a lower time frame.

1-day SEI/USDT Chart
1-day SEI/USDT Chart | Source: TradingView

These net capital flows also speak to the strength of SEI. In the 24-hour daily on-chain activity tracker, SEI witnessed total inflow of $3.1 million and outflow of $367.6K, resulting in a net inflow of $2.7 million. This makes it one of the chains with the highest net demand performance, after Ethereum and Base. This demand has no big headlines or announcements, and this means that the organic interest is constant.

SEI Remains Stable Despite General Outflows

Interestingly, the trend of capital inflows expands on the SEI multi-week pattern since it continues to attract liquidity despite other chains recording net outflows. Other projects, such as Solana and Polygon PoS, registered net outflows of well beyond 5 million and 10 million within the same time frame. A steady demand implies that users are investing more resources in the SEI system instead of moving to other options.

Snap
Snap | Source: X

The SEI’s market capitalization has increased to 1.12 billion, an increment of 4.63% in the past 24 hours. The 24-hour trading volume has declined 30.94% to $227.5 million. Still, the volume/market cap ratio stands in an encouraging condition, reaching 20.17%. This means that it is actively being traded against its size.

The combination of constant price gains, high support retention, and growing capital flows provides structural strength to SEI’s market position. It has been performing well despite general market volatility and unclear macroeconomic conditions, contributing to diminishing inflows at most other chains.

XRP ETF Odds Surge To 95% Ahead Of SEC Decision, Bloomberg Reports

0

Key Insights:

  • XRP ETF approval odds now stand at an impressive 95%.
  • SEC engagement signals rising confidence in XRP’s regulatory clarity.
  • XRP is approaching a launchpad according to charts, ahead of building anticipation.

The prospects for a spot XRP ETF (exchange-traded fund) in the United States have sharply increased, with Bloomberg analysts now assigning a 95% chance of approval by the U.S. Securities and Exchange Commission (SEC) in 2025.

This new projection marks a pivotal shift in the regulatory outlook surrounding digital asset ETFs and could unlock massive institutional demand for XRP.

XRP ETF Approval Odds Data
XRP ETF Approval Odds Data | Source: X

The final decision deadline from the SEC is set for October 17, 2025, according to multiple 19b-4 filings submitted by prominent asset managers, including Grayscale, Bitwise, 21Shares, and Franklin Templeton.

SEC Engagement Signals a Turning Point

The surge in confidence comes as Bloomberg ETF analysts James Seyffart and Eric Balchunas reported increased engagement from the SEC across several crypto ETF applications.

Their analysis suggests that the regulator’s dialogue with issuers is more robust and frequent than in previous cycles, which historically correlates with a higher likelihood of approval.

In particular, XRP’s inclusion in this wave of filings suggests the SEC may be moving toward a broader acceptance of cryptocurrencies beyond Bitcoin and Ethereum.

Seyffart commented on X that SEC interaction is a “very positive sign,” noting that while the timeline remains unclear, the tone of engagement appears constructive.

He acknowledged that final approvals could arrive within the next few months or closer to the October deadline, but emphasized that approvals now seem more a matter of “when, not if.”

A significant factor contributing to XRP’s strong odds is the growing belief that the SEC is inclined to treat it as a commodity rather than a security—a critical regulatory distinction.

This follows the partial legal victory Ripple Labs achieved in its ongoing case with the SEC in 2023, where a U.S. judge ruled that programmatic sales of XRP on exchanges did not constitute securities transactions.

While the legal battle is not entirely over, the ruling has reinforced XRP’s claim to commodity status, aligning it more closely with Bitcoin in the eyes of regulators.

This regulatory clarity is key for asset managers when structuring ETF products. Approval of a spot XRP ETF would signal that the SEC recognizes sufficient legal and market infrastructure to allow for regulated, exchange-traded access to the token, similar to the Bitcoin spot ETF approvals seen earlier in 2024.

XRP Approaches Launchpad Zone Amid XRP ETF Anticipation

Superimposed over the ETF storyline, we now find a necessary technical configuration occurring on the 4-hr XRP/USDT chart published by XForceGlobal.

Per the chart, XRP has finished contructing a long corrective wave, leading to a perfect forging core. Prices reverted back in the golden Fibonacci pocket, between 61.8% and 88.6%, a strong reversal territory.

At press time, XRP value was approximately $2.02. The set-up indicated that the asset was in the tail-end of Wave (2), which is a typical retracement period followed by a massive take-off of the Elliott Wave Theory.

The expected Wave (3) aims at a relocation substantially higher than the $4.00 level. This is why it may rise to $6.00 in the future.

XRP/USD Chart
XRP/USD Chart | Source: X

Despite the gut-level fear of a deeper correction, the market is not testing critical support at 1.61, that is, the point labeled as Protected Low.

So long as the price remains in the territory above this zone, the bull thesis stands, and the validation is the formation of a strong impulsive move out of the Fibonacci zone.

As the final SEC decision deadline for a spot XRP ETF approaches on October 17, 2025, optimism is surging.

Bloomberg’s 95% approval forecast, driven by increased regulatory engagement and institutional filings, represents a paradigm shift for XRP and the broader altcoin market.

With technical indicators aligning with the fundamental narrative, XRP is poised for a pivotal moment that could reshape its trajectory and the landscape of regulated crypto investment in the US.