Home Blog

Senator Elizabeth Warren Slams GENIUS Act—Is Trump’s Coin A Risk To The Nation?

0

Key Insights:

  • The GENIUS Act cleared a major Senate hurdle after 16 Democrats changed their votes and supported the bill.
  • The bill passed the cloture vote with a 66-32 margin and moved to the full debate and amendment stage.
  • The GENIUS Act proposes strict rules for stablecoin issuers, including 1:1 cash backing and criminal penalties for fraud.

The GENIUS Act cleared a major Senate hurdle after a surprising shift in support from key Democratic senators. The bill, which proposes new rules for stablecoins, passed a cloture vote with 66 senators in favor. The shift follows controversy surrounding the GENIUS Act’s potential links to President Donald Trump’s crypto interests.

GENIUS Act Advances After Senate Reversal

The GENIUS Act regained momentum after 16 Senate Democrats reversed their earlier opposition and supported the bill on Monday.

That stage of the legislation moved it past the cloture stage and into the full debate and amendment process. The bill passed this, but its final passage may not come until after Memorial Day.

Supporters argue the GENIUS Act provides needed regulation for U.S. dollar-backed stablecoins and helps prevent innovation from leaving the country.

The legislation requires stablecoins to be ‘fully reserved’ — meaning that they will be backed 1:1 by cash or its equivalent and imposes oversight of stablecoin issuers. It also adds criminal penalties for fraud to increase the trust level for the digital asset market.

Senate Republicans have pushed for the GENIUS Act as a key initiative to ensure U.S. dominance in the financial technology sector.

But advocates say it includes guardrails and space for growth in the wild west, which is the fast-evolving stablecoin space. They say global players could gain influence over U.S. financial systems without a national framework.

Trump-Linked USD1 Draws Warren’s Fire

Senator Elizabeth Warren has strongly criticized the GENIUS Act, citing potential benefits to Trump’s stablecoin project, USD1. She warned that the legislation would leave stablecoins open to private actors and create risks of financial misuse.

The bill would also give greater power to the crypto ventures of Trump’s family and fortify his financial conflicts of interest.

In his speech, Warren accused Trump of using USD1 to lock down deals’ with foreign entities just days before the Republican leader cut a $2 billion deal.

The deal—involving World Liberty Financial, a USD1 issuer, and MGX, a fund based in the UAE—raised transparency concerns. She argued that the GENIUS Act could shield such transactions from regulatory scrutiny and accountability.

Trump also allegedly encouraged personal promotion of the coin at his high-profile social get-togethers with highly valued holders, and the senator has criticized the president. She claimed such activities suggest conflicts of interest, as the GENIUS Act would expand opportunities for USD1’s growth. She says the bill doesn’t include protections to stop political figures from making money with crypto while in office.

Warren Demands Reforms to Crypto Bill

The GENIUS Act aims to reduce reliance on dominant stablecoins like Tether and Circle by supporting regulated U.S.-based alternatives.

But opponents say a bill to give the city political and legal control over the water supply might replace one monopoly with another, this time manned by the politically connected. However, this concern has only grown, particularly with the Trump family, which is now involved in crypto.

Trump’s current stablecoin, USD1, is now issued by World Liberty Financial, one of the fastest-growing stablecoins in the market.

The company’s rising influence and recent partnerships have drawn increased scrutiny as the GENIUS Act progresses. USD1’s inclusion in the top five stablecoins has made its role in the future regulatory landscape a central issue.

Supporters of the bill point to the modernization it would bring to financial policy, but opposition to the measure is firm on unresolved concerns.

As debate resumes this week, lawmakers were under pressure Monday to revise the bill to close any potential loopholes. It comes down to the Senate adding amendments to cap personal gain from crypto.

Warren has called on fellow senators to oppose the GENIUS Act unless it includes measures to prevent political self-enrichment.

She says the legislation must separate regulatory efforts from personal business gains by public officials. Absent such provisions, Warren says the bill could allow for private enrichment through government-backed regulation.

Bitcoin Blasts to $109K—Is the $150K Moonshot Now in Sight?

0

Key Insights:

  • Bitcoin reached a new all-time high of $109,565 on May 21 after weeks of consolidation above $100,000.
  • The rally followed Texas’ approval for holding Bitcoin in its strategic reserve, boosting institutional confidence.
  • Trading volume surpassed $44.5 billion, marking the highest level since May 9 and indicating strong market participation.

Bitcoin surged to a new all-time high of $109,565 on Wednesday, May 21, marking a significant milestone. The sharp rise came after weeks of consolidation above $100,000, signaling strong bullish momentum. With macroeconomic shifts and increasing demand from institutions, Bitcoin now targets the $150,000 level as the next potential stop.

BTC|USD Price chart
BTC|USD Price chart| Source| Coingecko

Bitcoin Breaks Records as Capital Rotates From Gold

Bitcoin’s latest price surge reflects aggressive capital inflows as major holders continue accumulating. Whale entities, including Strategy and Bitcoin ETFs, have maintained steady buying pressure since early May. The price reacted sharply to Texas’s legislative approval allowing the state to hold Bitcoin in its reserves.

This new development intensified positive sentiment, pushing Bitcoin to $109,656 before consolidating near $105,000. It confirmed solid market participation as trading volume topped $44.5 billion, the highest since May 9. Contrary to this, on-chain metrics reveal that long-term holders don’t seem bothered, with no major distribution signs.

At the same time, capital is being withdrawn from traditional safe-haven assets to Gold as recession concerns rise. Meanwhile, gold ETFs recorded their largest outflow since 2013, at $2 billion, which was directed to the US, Japan, and offshore. This trend points toward a strategic reallocation of capital into Bitcoin as economic uncertainty increases.

Key Price Levels and Technical Signals Indicate Uptrend

Bitcoin trades above key short-term moving averages, supporting a strong technical structure. The 5, 8, and 13-period SMAs—at $105,767, $104,946, and $104,489—remain aligned beneath current price levels. This alignment confirms continued upward momentum within a rising channel formation.

Bitcoin Price Forecast Today
Bitcoin Price Forecast Today | May 21 | BTCUSDT (Binance)

Bitcoin must clear $110,000 to confirm the next leg of the rally toward $125,000 and beyond. If price breaks and holds above this psychological barrier, increased volume could propel it toward $150,000. The latest wick to $109,845 and strong closing support at $106,834 suggest a resilient trend.

However, failure to hold above $105,000 could trigger a decline toward the $100,000 zone. The 13-period SMA remains critical support; a close below may indicate short-term weakness. Yet, sustained net positive volume of 1.69K suggests that buying pressure remains dominant.

Macroeconomic Signals Strengthen the Bullish Case

According to the data, the Consumer Sentiment Index fell to 50.80, a historically recessionary level. This development has pushed major funds to reduce exposure to US equities and increase positions in Bitcoin. Several leading hedge funds now hold long positions in Bitcoin while shorting traditional markets.

Market analysts say weakening stock performance and declining confidence are signs of a broader capital shift. With the US Fed expected to discuss rate cuts in June, monetary policy could further accelerate Bitcoin demand. The weakening dollar and de-dollarization efforts in global markets also enhance Bitcoin’s appeal.

At the same time, long-term support is furthered by government state-level adoption and strategic reserve planning. Institutional demand continues to grow as Bitcoin crosses $2.4 trillion in market capitalization. The data also shows entities with over 1,000 BTC sitting in accumulation mode, a sign the coins won’t be selling anytime soon, further supporting a sustained upside.

Bullish Outlook Ahead of Q3 as Bitcoin Maintains Strength

Bitcoin’s recent breakout has created a strong setup heading into Q3. However, top firms’ financial analysts say things will continue to rally if economic instability worsens. To date, good technical and macro signals still lead us to believe that $150,000 is a reachable target.

We show price action clearly, with higher lows as volume continues to rise. Consistent buying patterns tell us a story of a market controlled by the bulls. As profit taking occurs intermittently, traders push the price higher, with daily candle patterns forming long upper shadows. Bitcoin’s structural support between $104,000 and $106,000 remains intact, preventing deeper pullbacks.

Dogecoin Price Struggles At $0.22 Amid Bullish Breakout

0

Key Insights:

  • Dogecoin (DOGE) traded near $0.22 as short-term breakout signals bullish strength building.
  • Analyst ali_charts suggests a possible pullback to $0.213 before any move higher.
  • The daily channel pattern indicates a potential rally if DOGE holds above key support levels.
Dogecoin price is holding at $0.2195, reflecting both bullish and bearish market sentiments. Traders are watching closely as momentum shifts in different directions.

While some analysts believe the price could rise again, others think it might drop in the short run. Traders are closely monitoring key areas due to mixed sentiment. The $0.213 level is attracting particular attention.

As the chart shared by ali_charts shows, Dogecoin price could soon reach the $0.213 level again. The price faced rejection at nearly $0.2310, preventing further upward movement. As a result, it failed to maintain higher support zones, leading to the forecast.

dogecoin price
Source: X

Every time the price tries to climb above $0.2310 on the 1-hour chart, it is quickly sold off. The $0.2380 level has remained strong, and the trend of lower highs indicates that the market’s momentum is decreasing.

Short-Term Breakout of Dogecoin Price Contrasts with Bearish Reversal Risk

While the long-term chart is bearish, the shorter-term charts indicate that the market is moving up. According to Trader Tardigrade, a 15-minute chart reflects that DOGE is breaking out of a tight range between $0.2230 and $0.2255.

doge usd
Source: X

The rise in RSI indicates that buyers are gaining momentum in the market. Once the breakout occurred, Dogecoin price reached $0.2280 but met resistance. Although the price is still below important levels, the market has shifted into an uptrend due to buyers taking charge.

The sudden price rise happened after a long period when prices were not moving much. The move did not last above $0.2280. However, the signs suggest bullish momentum may continue if the market and trading volume support it.

Falling Channel Pattern Could Set Up Larger Move

Looking at the daily chart, we can see Dogecoin is moving within a sloping channel. This is the second time this has happened in recent weeks.

The first channel ended in late April when the price broke out and rose sharply. Currently, the channel goes from $0.1900 to $0.2400, and the price is generally around $0.2240.

doge price
Source : X

Based on the chart, the price may keep moving within the channel before attempting to break out. The shape of the pattern suggests that, in the past, a W-formation in the channel led to higher prices. If the market breaks above the channel’s top line, it could revisit the level at $0.2650.

At the moment, the $0.213 level is very important for Ethereum. When the price revisits the suggested level, it could help the market bounce back within the overall pattern. However, if the price falls below the level, it could end the channel breakout and make the asset retreat further.

On-chain data introduces an extra aspect to the existing system. Based on Coinglass, the funding rate for Dogecoin has generally been positive over the past two weeks.

It has reached 0.0089%, meaning there are more long positions than short ones in the futures market.

DOGE weighted funding rate
DOGE weighted funding rate | Source: Coinglass

When the funding rate is positive, traders pay to keep long positions, indicating they expect the market to rise. Since the funding rate and price are positively correlated, investors are still interested, suggesting the price could increase.

At the same time, Bitcoin dominance charts indicate that the market may be experiencing a “Dead Cat Bounce.”

According to MerlijnTrader, altcoins might attract more capital once Bitcoin dominance declines. If this occurs, Dogecoin price might pick up speed even after a brief test of $0.213.

Market cap BTC dominance
Market cap BTC dominance | Source: X

During the beginning of altseason, it is common for funds to move from Bitcoin to altcoins. If Bitcoin’s dominance falls below 63%, it could indicate that people are buying more altcoins such as DOGE.

Bitcoin ETFs Cool as Miners Dump $252M — Will BTC Drop as RSI Flashes Warning?

0

Key Insights:

  • Bitcoin ETFs see inflows drop 90%, cooling from $2.72B in April to just $277M recently.
  • Miners offload over 2,400 BTC worth $252M, with reserves falling to 1.8092 million BTC.
  • Bitcoin RSI crosses 70, signaling overbought conditions and risk of a short-term pullback.

Data from CoinGecko shows that Bitcoin (BTC) is trading around $105,000 after a turbulent 24 hours during which it gained about 0.8%. The price has risen by around 2.4% over the past week and close to 23% over the past month. Bitcoin is up nearly 59% on a yearly basis.

The cryptocurrency market is sending mixed signals despite the steady price recovery. On the daily chart, Bitcoin’s relative strength index (RSI), a momentum indicator, is now overbought. According to this reading, Bitcoin could be in for a pullback as short-term buyers take profit.

Meanwhile, there is caution in market activity in Bitcoin exchange-traded funds (ETFs) and among miners. There are several metrics that indicate cooling momentum and near-term headwinds.

ETF Flows Decline After April Surge

Net inflows into US spot Bitcoin ETFs have slowed sharply. While weekly ETF inflows hit $2.72 billion in late April, the latest data available shows inflows of around $277 million. This is almost a 90% reduction in net investment into Bitcoin related ETFs.

BTC US spot ETF net flows
BTC US spot ETF net flows / Source / X

The lack of interest in ETFs could be due to market participants taking profits or moving capital to other sectors. Large inflows in the early part of 2024 helped BTC to break above $100K. The recent decline may be a pause in institutional buying or a more cautious stance by large investors.

It has been evident that ETF flows are correlated with the movement of the Bitcoin price. BTC’s price shot up during the period of strong inflows in April. However, the price gains started to plateau as the inflows slowed in May, indicating that the rally may be losing strength unless new capital comes in.

Miners Sell Over 2,400 BTC as Reserves Fall

Bitcoin miners sold over 2,400 BTC in the past 24 hours, worth over $252 million in market value. The rise in BTC prices often leads to miners realizing profits, and this spike in selling coincides with that.

Bitcoin miner reserve
Bitcoin miner reserve – all miners / Source / X

CryptoQuant reported that the miner reserve, which tracks the total BTC held by mining firms, plunged drastically between May 17 and May 18. The number dropped from 1.8104 million BTC to 1.8092 million BTC before recovering slightly. This type of movement indicates miners are selling coins and moving them to exchanges.

Selling Bitcoin in large scale by miners can put downward pressure on its price. In the event of a sharp decline in reserves, it could mean that miners are anticipating lower prices in the future or are taking advantage of recent gains.

BTC RSI Signals Overbought Conditions

According to technical data, Bitcoin’s RSI has broken above the 70 level, indicating that the asset has become overbought. Traders expect a cooling off period or a short term correction when this happens.

Bitcoin relative strength
Bitcoin relative strength index (RSI-14) / Source / X

BTC’s RSI-14 has been elevated for a few sessions as per Glassnode charts. Additionally, the RSI has been rising in tandem with the price trend over the past two weeks.

While, RSI values will often correct or consolidate sideways when they remain high without new inflows or trading volume support.

Similarly, the RSI readings are in line with the current cooling of ETF flows and miner selling. This means that unless new buyers enter the market, BTC could face resistance above $105K.

Bitcoin Dominance Chart Suggests Possible Drop Ahead

Separately, CryptoCove also shows Bitcoin’s dominance in the total crypto market is in a bearish wedge pattern. It appears that a potential ABC corrective wave is forming, which could lead to a drop in BTC market dominance from the current 63.92%.

btc price
Source / X

The b wave of the pattern is nearing completion and if it is a typical Elliott Wave correction, the c wave may dominate lower towards the 60% level. If traders rotate funds out of Bitcoin and into other crypto assets, this could be good for altcoins.

If inflows wane and selling activity picks up, BTC price movements may become more volatile as dominance falls. This also applies to the broader market, where traders seek higher returns on smaller cap assets when Bitcoin’s momentum stalls.

Kraken Unleashes MiFID II Platform—But What Is ‘KRAK’ All About?

0

Key Insights:

  • Kraken has secured a MiFID II license by acquiring a Cypriot investment firm, allowing it to offer crypto derivatives in the EU.
  • The Cyprus Securities and Exchange Commission has approved Kraken’s operation under the MiFID II framework.
  • Kraken can now legally provide perpetual and fixed maturity futures contracts across the European Economic Area.

Kraken has advanced its global expansion by securing regulatory approval to offer crypto derivatives across the European Union. The crypto exchange obtained a MiFID II license by acquiring a Cypriot investment firm. This move allows Kraken to legally serve retail and institutional users throughout the European Economic Area.

Kraken Gains Ground in the European Market

‘Per Cypriot money services license obtained in July, the Cyprus Securities and Exchange Commission has approved Kraken’s application to operate within the MiFID II framework. Kraken stated,

“This approval enables the platform to offer perpetual and fixed maturity futures contracts across EU member states.”

Germany, France, and the Netherlands can now work with Kraken’s derivatives infrastructure.

Cyprus is a beachhead to expand Kraken’s regulated services in Europe in accordance to its strategy of acquiring a license, it added. Demand for regulated digital asset services keeps moving at breakneck speed in Europe, and derivatives are particularly in high demand. While ensuring it abides by local laws and rules, Kraken plans to tap into this demand.

The exchange has stressed improving existing products instead of introducing new contract types. European users, on the other hand, benefit from Kraken’s infrastructure, which provides for efficient trade execution and smooth fund transfer. This structure provides liquidity access in the EU network and reduces operational costs.

Derivative Trading Now a Core Business for Kraken Exchange

Crypto derivatives have become central to Kraken’s product suite, with the exchange reporting massive global trading volumes. Markets are participating very strongly, but today, derivatives trading is near or under $1 billion, which we think will grow. The firm said the instruments at play account for most of its platform’s activity.

The world has heaved deep over to derivatives as crypto trade volumes constitute almost 75% of the markets. Kraken has stood ready to address this demand with well-known contracts featuring established market structures. This building continues, and it’s expanded geographic access and regulatory compliance.

Previously, Kraken’s derivatives portfolio benefited from earlier acquisitions of platforms such as Crypto Facilities and NinjaTrader. Through these deals, Kraken got a larger user base and some technical capabilities in the US and the UK. Neither of these services has integrated particularly well, setting Kraken on the right path to be the authority for regulated crypto trading.

Kraken Expands Its European Ecosystem with Embed and Licensing

In Europe, Kraken also launched its Embed application to enable neobanks and fintech platforms to offer customers access to the service. Through this integration, these partners can now offer their customers spot and derivatives trading via the platform. This Embed tool provides easy access to Kraken’s trading engine and liquidity network.

Kraken operates under MiFID II license with wider operational flexibility and greater attractiveness in jurisdictions like Cyprus, but not so much in places like Germany and Hong Kong. These locations enable rapid rollout of provider services due to their efficient paths to regulatory approval. These jurisdictions have proved crucial to Kraken’s ability to continue to grow.

Kraken’s move coincides with the growth curve of the EU as one of the fastest growing digital asset markets. While focusing on serving the regional regulatory requirements, the firm is still expanding its service infrastructure. This approach guarantees long-term European scalability and legal stability.

The pending onboarding of a Cypriot investment firm acquisition and MiFID II license is a major milestone for Kraken in its European growth plan. The approval provides Kraken with additional capability to offer derivatives in regulated environments in a way that relies on its robust infrastructure.

Argentina President Javier Milei Ends Libra Unit Amid $4B Scam Fallout and Fresh Probes

0

Key Insights:

  • Argentina has shut down the special investigation unit assigned to probe the Libra cryptocurrency scandal.
  • The Ministry of Justice stated that the investigation unit completed its objective before the government officially disbanded it.
  • President Javier Milei and Justice Minister Mariano Cúneo Libarona signed the order to dissolve the investigation task force.

Argentina’s government has officially shut down the Unidad de Tareas de Investigación (UTI), the special unit probing the Libra cryptocurrency scandal. The Libra token controversy involved President Javier Milei and his sister Karina, triggering public backlash and judicial scrutiny. The Ministry of Justice stated that the UTI completed its task before its closure, but questions remain as probes deepen.

Libra Task Force Closed as Probes Grow

The UTI was created to investigate the rapid rise and collapse of the Libra crypto token, which is tied to political promotion. Argentina’s Ministry of Justice said President Milei and Minister Mariano Cúneo Libarona signed the disbandment order. After the unit was dissolved, officials said the task force gave its findings to the public prosecutor.

Nevertheless, the case remains open since new legal actions keep being opened. Just last month, a federal judge in the case ordered Argentina’s central bank to unseal bank accounts tied to Javier and Karina Milei. However, the timing of the UTI shutdown has troubled many, and audits and freezes on financial assets have been initiated.

Karina Milei serves as the General Secretariat of the Presidency and has remained a key figure throughout the Libra controversy. Authorities also froze assets belonging to three Libra co-founders, who are believed to have facilitated the scheme.

Libra Token’s Launch and Sudden Collapse

Libra launched in February under Kelsier Ventures, a Delaware-based company, and quickly gained massive online traction. Hours after the launch, President Milei posted on X touting the token as a financial tool for small businesses. His post included the Libra contract address and the website link, which caused a market surge.

Milei’s promotion sent the token’s market cap soaring to $4.5 billion within hours, driven by speculation in the token, which picked up some momentum before Milei flouted his own BANHAU campaign rules. However, the rapid growth was followed by a steep decline, wiping out 80% of Libra’s market value. After the crash, Milei deleted his tweet and said he did not have any prior knowledge of or intent to market the token for profit as he posted it.

He described himself as a technology supporter but denied involvement in planning Libra’s launch. Meanwhile, Hayden Davis, linked to Libra, claimed he paid Karina Milei to influence her brother’s promotion of the token. He also stated he controlled wallets worth over $100 million gained through the Libra project.

Retail Losses and Insider Profits Raise Alarm

The Libra collapse led to financial losses of $251 million, impacting many retail participants. According to research, 86% of project participants lost money on the project. Token holders in a small group of wallets are reportedly making profits by withdrawing money when the token had its peak.

Reports identified eight wallets that pulled $99 million from the Libra liquidity pool before the crash. These wallets received tokens directly from Libra’s creators, indicating early access and coordinated activity. However, investigators have not publicly confirmed the identity of these wallets.

And despite official denials, Karina and Javier Milei continue to be public scrutiny targets of ongoing money probes. Argentine media called the scandal the “CryptoGate,” and it pressured the administration to deal with the troubles. Authorities are still working to trace the flow of funds related to Libra and examine potential misconduct.

Bitcoin Eyes New Highs After $66.3M Shorts Liquidated On Binance

0

Key Insights:

  • Binance recorded the year’s largest short liquidation, totaling $66.3 million on the BTC/USDT trading pair.
  • Wallet data shows increasing accumulation across nearly all holder groups, led by large BTC investors.
  • A supply cluster at $106.6K, holding 31,000 BTC since December, continues to act as price resistance.

Bitcoin shows strong upward momentum following a major short liquidation event on Binance. There, $66.3 million in positions were wiped out. This marks the largest such event of 2025, triggering renewed interest in price movement and investor behavior.

Meanwhile, the accumulation rate is rising for nearly all types of wallets. Despite vigorous buying activity, Bitcoin struggles to break past the $106.6K resistance level. 31,000 BTC have remained untouched since late 2024, adding to the market uncertainty.

$66.3M in Shorts Liquidated on Binance: A Shift in Market Sentiment

On May 19, 2025, Binance experienced its biggest short liquidation on the BTC/USDT pair for the year. In a few hours, $66.3 million in short positions were eliminated.

Bitcoin short liquidations USD
Bitcoin short liquidations USD | Source: CryptoQuant

Short liquidations occur when traders borrow Bitcoin, expecting the price to drop. If the price increases, they have to pay more to repurchase it, which leads to a squeeze. The sharp price rise caused the squeeze, taking Bitcoin above $106,000 before it pulled back a little.

Bitcoin’s price is struggling to rise beyond $106.6K due to heavy buying at that level. Glassnode reports that over 31,000 BTC have been purchased there, creating strong resistance. Since December 16, 2024, this cluster has not changed.

Strong resistance at $106.6K
Strong resistance at $106.6K price level |Source: glassnode

The fact that the coins are not being moved by those at that level indicates they are not interested in selling. Bitcoin reached this level but then dropped, indicating that it might take more energy to break through.

Wallet Cohorts Show Accumulation Across the Board

Moreover, Bitcoin is being held by people with wallets of all sizes. Holders with less than 1 BTC accumulate instead of selling, as the trend accumulation metric is 0.55.

Those who hold 100 to 1,000 BTC tend to have a strong score of nearly 0.9. The group with 1,000 to 10,000 BTC has a score of 0.85, just slightly lower than the top group. It shows that even major investors are still increasing their investments.

Bitcoin accumulation across
Bitcoin accumulation across wallet cohorts | Source: glassnode

Only those with 1 to 10 BTC wallets still sell their coins. Their score is less than 0.5, meaning they sell more than they buy. If Bitcoin remains above $100,000, they may soon start accumulating more.

The heatmap in the data clearly shows this. Red and orange, indicating high accumulation, are seen in almost all age groups. Blue tones show selling and are now only present in a few locations.

Bitcoin-Gold Correlation Turns Negative in the Short Term

On the other hand, Bitcoin’s connection to gold over the past 30 days is now -0.54. It is the lowest level seen since February 2025. This means that Bitcoin is moving up while gold is moving down. Bitcoin tends to go down when gold goes up, and the opposite is also true.

Bitcoin correlation to Gold
Bitcoin correlation to Gold | Source: glassnode

At the same time, the relationship between the two remains positive over the longer term. The correlation for 90 days is 0.39, while it is 0.60 for 365 days. These statistics indicate that Bitcoin and gold have moved together for several months.

It seems that Bitcoin is now responding more to changes within the crypto market than to the overall economy. While gold has dropped in price, Bitcoin faces new resistance levels.
Gold reached a high of $3,400 in early May, but its price has since dropped to below $3,300. Meanwhile, Bitcoin has reached $105,000 in the same period, suggesting it is not performing the same as gold.

What the Data Means for Bitcoin’s Next Move

Because of the quick liquidations, traders betting against Bitcoin had to close their positions. As a result, the price rally drew near $107,000.

The increase in wallet activity is also driving prices higher. Most investors are still buying, which will help the market in the long run. For now, only the 1 to 10 BTC group is still distributing. However, things could change if prices stay the same or increase further.

The level of resistance at $106.6K should be monitored. A move above that level could allow the price to reach new heights. Still, a high supply might slow down any further gains at that stage.

In the short run, Bitcoin has become independent of gold. This could mean it can soon choose a different direction than traditional safe-haven assets.

Bitcoin’s Coinbase Premium Turns Positive—Is a Mid-Term Rally Ahead?

0

Key Insights:

  • Coinbase Premium Index enters bullish territory at 0.03.
  • Realized Cap rises to $906B, reflecting strong conviction.
  • Sentiment remains bullish as BTC holds near $104K.

Bitcoin is currently valued at $103, 022 and several indicators are pointing towards a mid-term bullish trend. Recently, the Coinbase Premium Index, which is used to monitor institutional demand in the U.S., has turned positive again. In the past, such actions have often been followed by higher prices, and many investors are now monitoring the situation to see if it happens again.

Meanwhile, market opinions are very optimistic and realized capitalization keeps going up. Although the asset is approaching significant resistance levels, the recent changes show that investors are becoming more confident.

Coinbase Premium’s Price Rises After Being Below Zero for Many Months

The Coinbase Premium Index is currently at 0.03, which is above zero. It shows the gap between Bitcoin’s price on Coinbase which is commonly used by U.S. institutions and the price on Binance and other international exchanges.

If the value is positive, it may suggest that American institutional investors are interested in buying the company’s shares.

Bitcoin Coinbase premium
Bitcoin Coinbase premium index | Source | CryptoQuant

During this period, the index frequently remained below zero. They indicated that institutional players were less interested in the market at that time.

Yet, the recent rise in their values suggests they could be coming back to the market. Over time, this trend has coincided with medium-term rises in Bitcoin’s price, but it continues only if there is lasting interest.

When the token had positive readings in the past, it rose sharply afterward. Market analysts are now questioning if this new increase will act the same as the previous rise above $100K. If this is the case, it might encourage people to buy more in the upcoming weeks or months.

Sentiment Turns Very Bullish Across the Market

Moreover, Alpha Crypto’s Sentiment Gauge charts now indicate that traders and investors are feeling very bullish.

Across April and May 2025, price action is supported by a series of green markers, indicating that the oscillators were bullish to very bullish. They are determined using price trends and other important indicators in the market.

Alpha crypto sentiment
Alpha crypto sentiment gauge | Source | Alphractal

Confidence has been increasing since March 2025 and now matches what is common in bull markets. Still, when everyone is very optimistic, it can also cause problems. While it often brings in new money, it can also cause prices to drop if people become too enthusiastic.

The heatmaps indicate that there are fewer red and orange areas, which used to be more common earlier. This means that there is more agreement among market participants as their confidence grows.

Bitcoin’s Realized Cap Nears All-Time Highs

Meanwhile, the total value of all coins at the last time they were moved is now $906 billion. CryptoQuant’s data for this metric usually represents the confidence of investors more than the recent changes in prices. Bitcoin is currently valued at $104.5K and the realized cap is continuing to rise.

Bitcoin realized cap
Bitcoin realized cap | Source | CryptoQuant

A rise in realized cap usually means that more coins are being bought and sold at higher prices which suggests demand is increasing. In the past, a rising realized cap has usually contributed to new record highs.

According to CryptoQuant, if the Realized Capitalization keeps rising and people keep showing confidence in Bitcoin, it is likely that Bitcoin will reach a new all-time high soon. The current price of ATH is barely above the $106,000 mark, which it reached earlier this year.

Long-Term Fibonacci Levels Show Key Resistance Zones Ahead

On its own technical analysis chart, Bitcoin’s price is still below the 1.618 Fibonacci extension which is currently at $101,343. Often, this level is the first area where prices break out. Still, traders are paying closer attention to the next levels: the 2.618 Fib at $154,522 and the 3.618 Fib at $207,701.

btc price chart
Source | X

This situation has happened in the past as well. In 2021, Bitcoin reached a high of 3.618 and it is expected to do so again. If Bitcoin surpasses the 2.618 extension, it may reach the upper resistance zone at $207,000.

A long-term ascending channel is visible on the chart and previous highs and lows follow the same pattern. This indicates that the asset is still rising and has not yet come close to its ultimate resistance level.

ENA Slides as Whale Dumps 12M Tokens—Is More Selling Ahead?

0

Key Insights:

  • Whale dumps 12.16M ENA, realizing $817K loss, adding pressure on short-term price action.
  • ENA risks drop to $0.259 as technicals weaken and support levels face retests.
  • Despite selling, USDe supply surges $300M, signaling strong growth in Ethena ecosystem.

The price of Ethena’s ENA token has dropped after a large whale sold 12.16 million tokens valued at $4.42 million. According to Spot On Chain, the move seems to end a three-month trade that cost the company $817,000 or around -13.1%. This is one of the biggest losses on ENA for a single address in recent times.

$ENA
Source | X

In February, the first record of wallet 0xb7d showed that it withdrew more than $5.8 million in ENA. In addition, another new wallet received $3.8 million in ENA and $2.15 million in AAVE. Together, they took out almost $10 million in ENA in just one day.

ena price
Source | X

Such accumulations led to bullish optimism. But because of the May 18 deposit and realized loss, the original expectations did not happen. The PnL chart shows that the average price for buying was $0.404 and the average price for selling was $0.347.

At the same time, the price of ENA is returning to the $0.35 range. If a lot of big investors leave the market, there may still be high pressure on prices in the short run. As per recent technical analysis, $0.26 is the potential support level.

Leverage Trading Also Signals Broader Weakness

Meanwhile, another whale put in $10.1 million into Hyperliquid and took long positions with leverage on ENA, PEPE and NEAR. Still, the positions were closed before the market moved, causing a loss of $400,000. The wallet currently has a 5x leveraged position in HYPE and has also set up an open order for TIA.

ena, pepe, near , hype, tia
Source | X

Onchain Lens reports that this trader has lost $929,000 during the past 10 days. The recent losses experienced by spot and leveraged traders are making people notice ENA’s short-term fluctuations. If the current selling reflects how people feel, it could lead to further declines.

Furthermore, according to CoinGlass, the funding rate for ENA’s OI-weighted data has mostly been negative. Most of the time in March and April, rates were either unchanged or negative and prices were moving down. Traders seem to lack confidence in the market’s ability to rise further at the moment.

ENA weighted funding rate
ENA weighted funding rate | Source | Coinglass

Technical Setup Suggests Retest of Lower Support

According to the 4-hour chart for ENA/USDT, the token is trading at $0.348, below the important level at $0.359. The price has gone past this level and has not returned to it yet. If ENA does not rise above this zone, the current trend could turn bearish.

ENAUSD price forecast
ENAUSD price forecast | Source | Tradingview

Moreover, the supertrend indicator has turned red, MACD lines are still below zero and the histogram bars are starting to flatten. If the price continues to fall, the next support is found at $0.259, which is 27.89% below the current price.

It implies that traders are on the lookout for improvements or more declines. Should the price stay above $0.359, the market mood may calm down, but the current signs suggest being cautious.

Growth Narrative Still Active Despite Price Weakness

Although investors are selling and being cautious right now, some developments in the ecosystem could change people’s opinions.

In just one week, Ethena increased the supply of its USDe stablecoin by $300 million. The previous time a supply jump like this took place, in October 2024, ENA went from $0.25 to $1.25 over a period of two months.

Ethena growth initiatives
Ethena growth initiatives | Source | X

The roadmap for Ethena in 2025 mentions collaborations with Hyperliquid, Telegram and Aave, as well as a new blockchain focused on RWA, launched by Securitize. It is significant that BlackRock is listed as an investor in Securitize, which might attract the interest of traditional finance companies.

ethena usde
Source | CoinGecko

According to CoinGecko, USDe’s value has increased significantly in the last few days. Between January and March 2024, USDe saw an addition of $3.6 billion. The next year, another $3.7 billion was added and the token’s cap is now $4.98 billion.This means the economy is still growing, but ENA’s price is not yet showing that strength.

Pi Coin Faces Pressure Amid Supply Surge and Market Uncertainty

0

Key Insights:

  • Pi Coin has dropped over 50% in the past week and is now trading near $0.70.
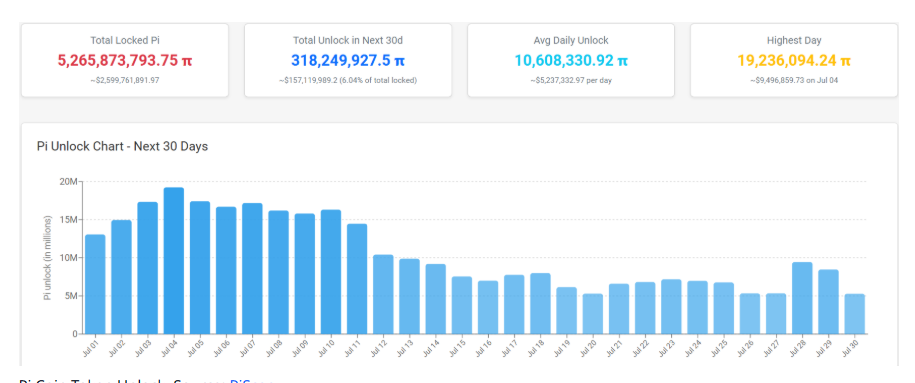
  • A total of 5.7 million Pi Coin tokens is unlocking today, which may increase selling pressure.
  • The number of Pi Coin tokens on exchanges has reached a record high of 397 million.

Pi Coin has been facing strong selling pressure. Its price has dropped over 50% in the past week. Currently, it trades near $0.70.

Investors are worried about further declines. Today, 5.7 million tokens will be unlocked. This could add even more downward pressure.

Pi Coin Faces Pressure as Supply Increases and Exchange Holdings Reach New High

The current number of Pi Coins being unlocked could lead to a substantial rise in the number of Pi Coins available for trading. As a result, increased supply could result in more people selling their tokens. For this reason, the price of Pi Coin could keep dropping all day.

On the other hand, the amount of Pi Coin deposited on exchanges has jumped to 397 million. This means many token owners plan to sell or trade their cryptos. When new coins are unlocked, the exchanges’ reserves may increase.

The sudden increase in these tokens suggests that people’s beliefs about the market are changing. Though some people favor the project, others are ready to leave. Should new demand for Pi Coin stay the same, the rise in supply could significantly lower the coin’s value.

Pi Coin Transparency Faces Growing Doubts

Dr. Altcoin spoke out and raised doubts about the transparency of Pi Network’s operations. He mentioned that the team is responsible for over 10,000 wallets and sub-wallets. Still, individuals can only trace the actions of the seven largest wallets.

So far, the Core Team has not worked on clarifying the transparency problem with wallets. Currently, members of the Pi Coin community disagree about the project’s claims and future. A few supporters remain loyal, whereas some fans are asking for answers.

Dr. Altcoin questioned whether some people support the Core Team because they are connected. He urged that more transparent and stronger supervision be implemented. The debate is fueling uncertainty about how long Pi Coin can continue operating.

Lack of Major Exchange Listings Raises Doubts About Pi Coin’s Future

Many members of the Pi Coin community have asked Binance and other major exchanges to add support for Pi. A survey conducted in February showed that most people were in favor of this action. Still, supporters are disappointed that things have not moved forward as expected.

Regardless of the vocal support from the community, the major platforms have not agreed to list crypto coins. Binance might take more time to add this token as it follows strict guidelines. Since these markets are not open for the token, its exposure and trading are much lower.

The Core Team has started concentrating on growing the ecosystem and has launched Pi Network Ventures with $100 million in funds. However, people had differing opinions, since some expected the project to list on major exchanges sooner. The community becomes even less satisfied as the token’s price goes down.

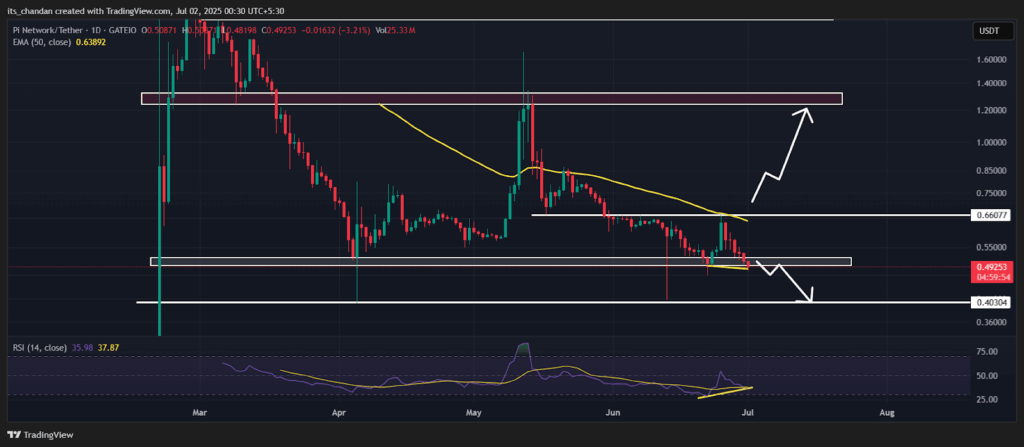
Pi Coin Struggles Below Key Averages

Pi Coin’s hourly chart shows that the token trades beneath these exponential moving averages, including the 20, 50, 100, and 200 EMAs, which also provide resistance. The current trend suggests that investors believe the market is going downward.

According to the RSI, which is 42.17, the token is currently in between neutral and bearish zones. The moving average based on the Relative Strength Index is lagging, suggesting buyers are uninterested. This situation signals that more downside could occur if the overall market volume does not change noticeably.

PI|USD 4-hour price chart
PI|USD 4-hour price chart | Source: TradingView

When the MACD line is a little above the signal line, a trend shift may occur. Yet, the market remains quiet, which can be understood from the flatness of the histogram. As long as things do not pick up quickly, the price of Pi Coin may continue to weaken.

HBAR Price Prediction: Will $0.50 to $1 Be Next?

0

Key Insights:

  • HBAR price prediction on the weekly time frame appears bullish and could soon hit the $0.33 mark in the coming days.
  • A crypto expert suggests that HBAR could reach $0.50 and even $1 if it maintains the $0.13 support level.
  • Exchanges have witnessed an outflow of a significant $18.50 million worth of HBAR tokens, indicating potential accumulation.

Hedera’s native token is retesting after posting notable gains over the past month. On the daily chart, it continues to form a higher high and higher low pattern, with the current price sitting at a higher low, indicating a potential continuation of its bullish momentum.

Current Price Momentum

At press time, HBAR was trading near $0.19 and had recorded a modest price surge of over 0.15% in the past 24 hours.

The ongoing volatility in the crypto market has caused traders and investors to hesitate in participating in the asset, leading to a 7.5% drop in trading volume during the same period.

Hedera (HBAR) Price Action and Technical Analysis

According to expert technical analysis, HBAR’s price prediction appears bullish and is on the verge of continuing its upward momentum in the coming days. On the daily time frame, the asset is moving in a higher high and higher low pattern. With the recent price correction, the current price has reached the higher low level, indicating a potential upside rally in the coming days.

The current level plays an important role in the upcoming move, as the asset is receiving support from the 200 Exponential Moving Average (EMA) on the daily time frame. However, if market sentiment shifts and the price falls, not only could the 200 EMA be breached, but the bullish continuation pattern may also fail, potentially leading to downside momentum.

HBARUSDT Daily Chart
HBARUSDT Daily Chart | Source: Trading View

HBAR Price Prediction

Based on recent price action and historical patterns, if market sentiment remains unchanged and the asset holds above the 200 EMA, the HBAR price prediction suggests that the asset could see a price surge of over 25% until it reaches the next resistance level at $0.25.

On the other hand, the HBAR price prediction could turn bearish if it fails to hold the 200 EMA and closes a daily candle below it. If this happens, there is a strong possibility of downside momentum of over 25% until it reaches the $0.138 level in the future.

As of writing, HBAR’s Relative Strength Index (RSI) stands at 50, indicating a neutral market stance with no clear bullish or bearish momentum. In this case, traders are either waiting for a shift in sentiment or for whale interest to move in either direction.

Expert Eyes $0.5 — $1 for HBAR

Looking at the daily and weekly charts, a well-known crypto expert shared a post on X (formerly Twitter) stating that a massive rally is loading for HBAR. In the post, the expert noted, “Price is holding the critical support at $0.130 — a confirmed base here could trigger a major upside move toward $0.50–$1.”

This shows a bullish sign for HBAR holders, as it has been gaining attention from experts.

$18.45 Million Worth of HBAR Outflow

In addition to this, whales and long-term holders have been accumulating the tokens, as reported by the on-chain analytics firm Coinglass. They have seized the recent correction as a buy-the-dip opportunity.

Data from spot inflow/outflow reveals that exchanges across the globe have recorded an outflow of a significant $18.46 million worth of HBAR tokens over the past seven days.

HBAR Spot Inflow/Outflow
HBAR Spot Inflow/Outflow | Source: Coinglass

This substantial outflow during the market correction indicates potential accumulation by investors and long-term holders, which could cause buying pressure and reduce further downside momentum.

Litecoin Price Prediction: LTC Poised for 32% Upside Rally

0

Key Insights:

  • Litecoin price prediction could remain bullish as long as it holds the key support level of $95.
  • Litecoin (LTC) is garnering significant attention from experts — some believe it could hit $150, while others think LTC below $100 is worthless.
  • Looking at the current market sentiment, 69% of traders on Binance are taking long positions on HBAR.

Amid the ongoing price correction, Litecoin (LTC) has continued to consolidate for the past eight consecutive trading days. On the daily chart, the asset appears to be forming a bullish price action pattern while holding the 200-day Exponential Moving Average (EMA) as support.

Current Price Momentum

At the time of writing, LTC was trading near $98.35, up by 2.75% over the past 24 hours. This surge in price, while maintaining key support, has garnered significant attention from crypto enthusiasts, leading to a 25% jump in trading volume, as revealed by CoinMarketCap data.

Litecoin (LTC) Price Action and Technical Analysis

According to the TradingView chart, the Litecoin price prediction appears bullish and is poised for a massive upside rally. Based on the price action, the asset seems to be potentially waiting for a sentiment shift to gain upward momentum.

On the daily chart, Litecoin has formed a bullish flag and pole pattern, with the current price holding support at the 200-day Exponential Moving Average (EMA).

LTCUSDT Daily Chart
LTCUSDT Daily Chart | Source: Trading View

Litecoin Price Prediction

Based on recent price action and historical patterns, if market sentiment shifts, the correction ends, and LTC breaks out of the flag and pole pattern, Litecoin’s price prediction suggests that LTC could see a 32% increase, potentially reaching the $135 level in the near future.

Besides the rally, the asset could face resistance near $110, which might pose a challenge during the upcoming move.

The Litecoin price prediction could turn bearish only if the correction continues and LTC falls below the key support at $95 and the 200-day EMA. If this happens, there is a strong possibility that the asset could drop by 8%, reaching the next support at the $86.50 level.

With the ongoing price correction, LTC’s Relative Strength Index (RSI) has dropped from the overbought zone to near-neutral territory and currently stands at 58, suggesting that bullish momentum is cooling off.

The asset is likely to resume upside momentum or end the correction only if strong buying pressure returns.

Experts Comments on Litecoin

The current price action of Litecoin has been garnering significant attention from crypto enthusiasts. Some believe that an LTC price below $100 is absolute nonsense, while others think the price could soon hit the $150 mark in the coming days.

Bullish On-Chain Metrics

Besides all this, the on-chain analytics firm Coinglass reveals that traders and investors are seizing the current price correction and appear to be betting on the bullish side, actively accumulating.

$16 Million Worth of LTC Outflow

Data from spot inflows and outflows reveal that exchanges have witnessed a consistent outflow of LTC during the correction period. Over the past seven days, $16.07 million worth of LTC tokens have moved out of exchanges.

LTC Spot Inflow/Outflow
LTC Spot Inflow/Outflow | Source: Coinglass

This substantial outflow indicates potential accumulation by long-term holders and investors, which could create buying pressure and further upside momentum.

68% of Traders Bets on Long Positions

Not only investors and long-term holders are seizing the current opportunity, but traders are as well. Data reveals that Binance LTCUSDT’s long/short ratio currently stands at 2.24, indicating strong bullish sentiment among traders. This metric further shows that 69.12% of top Binance traders are betting on the long side, while 30.88% are on the bearish side.

Binance LTCUSDT Long/Short
Binance LTCUSDT Long/Short | Source: Coinglass

When combining these on-chain metrics with the technical analysis, it appears that bulls are currently dominating the asset and could soon trigger a rally as sentiment shifts.

DOGE Price Prediction: Historical Patterns Hint At 40% Decline Ahead

0

Key Insights:

  • With historical price momentum, DOGE price prediction appears bearish and is on the verge of downside momentum.
  • Dogecoin’s large transactions soared by 41%, indicating rising interest from traders and investors. What does this mean for traders?
  • 78% of Binance traders are taking long positions on DOGE, while the remaining 80% are betting on short positions.

Amid the ongoing market correction, DOGE price prediction appears bearish and is on the verge of a crash. This bearish speculation arises as the meme coin repeats its historical pattern.

The last time this pattern formed, the Dogecoin price dropped by over 40%. Now, traders wonder if history will repeat itself.

Current Market Sentiment and DOGE Price Momentum

At press time, DOGE price was trading at nearly $0.219. It had recorded a price decline of over 6.50%, seemingly following its historical pattern.

The recent price drop and previous momentum have sparked increased activity among traders and investors. Interest in the meme coin is surging as more participants enter the market. According to the latest data, DOGE’s trading volume during the same period has jumped by 15%.

A sharp increase in trading volume while the price declines show strong bearish momentum. This is generally seen as a negative signal for the market.

Dogecoin (DOGE) Price Action and Technical Analysis

According to expert technical analysis, DOGE price prediction appears bearish and is poised for massive downside momentum.

Per the daily chart, the meme coin was rejected from a strong resistance level of $0.242. It has begun heading toward the next support level. The last time the meme coin reached this level, it recorded a price decline of 40%, and now it is repeating its history.

DOGEUSDT Daily Chart
DOGEUSDT Daily Chart | Source: TradingView

If Dogecoin stays below $0.24, its price may drop by more than 15%. The next support level could be the key to stabilizing its decline.

However, DOGE price prediction could turn bullish only if it breaches the $0.245 level and closes a daily candle above it. If this happens, Dogecoin could see a price surge of over 20% until it reaches the $0.31 level.

DOGE’s RSI is currently at 61, suggesting it is approaching overbought territory. However, it still has some potential to rise further. However, this would only be possible if market sentiment shifts.

Bullish On-Chain Metrics

Whales and traders are taking advantage of the recent market dip by accumulating assets. On-chain analytics tools, Coinglass and IntoTheBlock, are also betting on the bearish side.

Despite the bearish outlook, IntoTheBlock recently flashed a bullish signal for the meme coin. Large transaction volume, often linked to whales and institutions, has jumped by 42%.

This surge reflects growing interest and confidence in the asset. Meanwhile, daily active addresses have increased by 41.12% in the past 24 hours.

DOGE Large Transaction Volume
DOGE Large Transaction Volume | Source: IntoTheBlock

Besides this, traders strongly bet on the bullish side and dominate the meme coin. The Binance DOGEUSDT Long/Short ratio at press time stands at 3.61.

This indicated strong bullish sentiment among traders. This metric suggests that for every 3.61 long positions, there is a single short position.

Binance DOGEUSDT Long/Short
Binance DOGEUSDT Long/Short | Source: Coinglass

As of now, 78.32% of Binance traders are betting on DOGE long positions, whereas 21.68% are on the bearish side.

AVAX Price Prediction: Bears Take Control As $23 Support Breaks

0

Key Insights:

  • Avalanche (AVAX) may decline if it doesn’t stay above the $23 mark. Losing this level could trigger downside momentum.
  • Whale participation in AVAX has soared by 153%, while daily active addresses have increased by 17%, indicating a potential pullback.
  • Exchanges have recorded an outflow of $13.33 million worth of AVAX over the past seven days.

AVAX price prediction suggests the asset is on the verge of a crash. The token has failed to hold the key support level of $23. The cryptocurrency market has been correcting in recent days.

As a result, Avalanche’s value has declined significantly, opening the path for considerable downside momentum.

Whale Transaction Drops by 82%

Following the major breakdown, whale and institutional participation have plummeted, as reported by the on-chain analytics tool IntoTheBlock. According to recent data, the enormous transaction volume (typically linked to whales) has dropped by 82% over the past 24 hours.

Global In/Out of the Money
Global In/Out of the Money | Source: IntoTheBlock

This indicates that whales are avoiding participation in the asset during its downside momentum. These recent developments hit the AVAX price harder, recording a 6% decline over the past 24 hours. Meanwhile, the asset was trading near $22.50.

AVAX price might slow down or stop at $20.83, based on data from IntoTheBlock. This level was where 773.74K wallets bought 16.03 million AVAX tokens.

AVAX Price Prediction and Key Levels

According to the TradingView chart, AVAX price prediction has turned bearish and is poised for downside momentum. This bearish confirmation could be confirmed once AVAX closes its daily candle below the $22.50 level.

AVAXUSDT Daily Chart
AVAXUSDT Daily Chart | Source: TradingView

If the token successfully closes a candle below this level, it could drop over 25%. It could reach the $16 level soon. The price has been moving within a descending channel for a long time.

The sentiment remains unchanged on the weekly time frame. The price is now approaching the lower boundary of the pattern. It continues to follow the established trend.

The downside of the asset began after the AVAX price hit the 200 EMA on the daily time frame. Now, the price is moving below it, indicating that it is in a downtrend.

Meanwhile, AVAX’s RSI was neutral and stood at 50. This indicates that the asset is neither overbought nor oversold. However, given the bearish market sentiment, there is more probability that AVAX could face downward pressure in the coming sessions.

Mixed On-Chain Metrics

Some investors view the ongoing price dip as a buying opportunity and are accumulating assets. Meanwhile, traders use the bearish sentiment to place strong bets against the market.

The on-chain analytics firm Coinglass has reported these contrasting strategies. Overall, the market remains divided between accumulation and bearish speculation.

Data from the spot inflow/outflow reveals that exchanges have witnessed significant AVAX token movement. In the past 24 hours, they have recorded an outflow of $6.58 million worth of the asset.

AVAX Spot Inflow/Outflow
AVAX Spot Inflow/Outflow | Source: Coinglass

This substantial outflow during the downside momentum indicates potential accumulation. This could lead to buying pressure and an upside rally.

On the other hand, traders have been strongly betting on the bearish side. The $21.75 level has seen traders build $2.61 million in long positions over the past 24 hours.

Meanwhile, the $23.25 level has attracted $4.98 million in short positions. These levels have drawn significant trading interest.

AVAX Exchange Liquidation Map
AVAX Exchange Liquidation Map | Source: Coinglass

On-chain metrics and technical analysis suggest that bears have control over the asset. Their downward momentum may persist until the price hits a key support level.

60% Surge In Pi Coin: Is A Mainnet Breakout on the Horizon?

0

Key Insights:

  • Pi Coin surged 60% to $1.25, boosting the market cap to $8.87B.
  • Bitcoin crossed $104K, adding 350K new wallets in a single day.
  • Pi trading volume spiked 280% to $1.32B before the May 14 summit.

In the recent Pi Coin news, the price surged by 60% to $1.25, and the market cap rose to $8.87B. While this happened, the Bitcoin price exceeded $104K, creating thousands of wallets in a single day.

Additionally, Pi trading volume surged 280%, hitting $1.32B ahead of May 14, when the Consensus summit will be held.

Pi Coin News: 60% Surge Amid Positive Market Momentum

Pi Coin surged over 60%, reaching $1.25, driven by strong market sentiment. Expectations ahead of the upcoming Consensus Summit contributed to this price spike.

According to CoinMarketCap, Pi Coin’s market cap increased to $8.87 billion, representing a 34% increase. This aggressive rally was after a period of consolidation where the coin hit an all-time low of $0.40 a month ago.

Notably, intriguingly, the spike took place amid a bull run in the broader crypto market. Bitcoin surged past the $104,000 mark, making headlines worldwide. This rally was driven by optimism surrounding global trade deals, including a major agreement between the U.S. and the U.K.

The top digital currency gained 350,000 new wallets in a single day. This surge highlights strong retail participation and growing investor interest.

Such a general market optimism is likely to have spilled over to the Pi Coin, thus bolstering its recent gains. Analysts speculated that the better macroeconomic environment influenced investors. Both retail and institutional investors increased their investments in digital assets like Pi Coin.

Market Activity and Trading Volume Spike

Further on Pi Coin news, the trading volume increased by 280% to $1.32 billion, indicating increased investor interest. The recent Pi Coin price action temporarily placed the crypto into the top 20 cryptocurrencies by market capitalization.

Subsequently, this indicated its increasing relevance on the list of digital currencies. The volume spike is a key indicator of increasing liquidity and market confidence. This may be a leading indicator for further upward movement.

Upcoming Catalysts for Pi Coin

More so, the Consensus Summit on May 14 will become a defining moment for the Pi Network. Co-founder Dr. Nicolas Kokkalis is expected to give a keynote speech. This may unveil significant details concerning the network’s mainnet launch, exchange listings, and new DApp.

pi ecosystem
Source: X

Such developments may further enhance Pi Coin’s position in a competitive market of digital assets. Speculation about a listing on major exchanges like Binance and HTX has fueled investor optimism. This anticipation has played a key role in driving the bullish momentum.

Many investors believe in enhancements of the market exposure and liquidity. A successful mainnet launch could increase the utility of Pi and fuel further price gains for the cryptocurrency.

Long-Term Outlook for Pi Coin

Despite the recent progress, Pi Coin has faced challenges in transforming from a relatively niche project into a popular digital currency. If confirmed, the mainnet launch could be a crucial milestone for the network. It may enhance decentralization and boost its long-term value.

Nevertheless, the coin’s journey to greater adoption is also unclear, with regulatory barriers and pressures from established cryptocurrencies being hazards.

However, the current increase in market attention and trading volumes indicates increased investor confidence. Therefore, Pi Network is on the verge of a potentially defining moment before its mainnet milestone.

Sui Coin Price Prediction: Will Bulls Push Past $4.20 Resistance?

0

Key Insights:

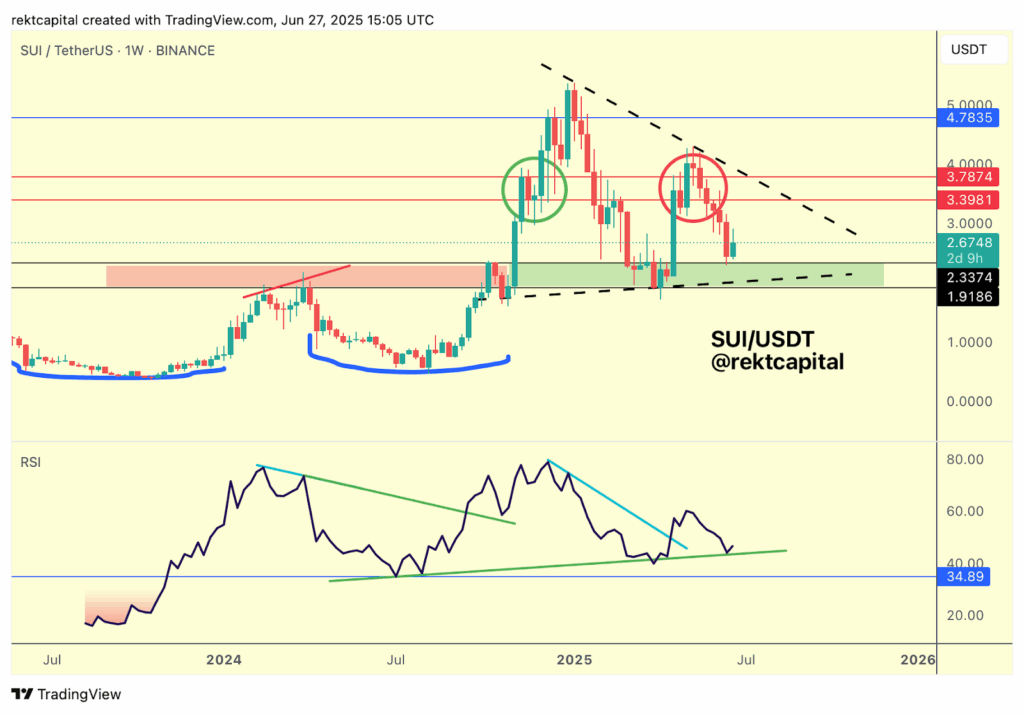
  • The SUI coin price continues to trade within a narrow range around the key support level of $3.83 for several weeks.
  • Over $13.70 million worth of SUI coins have flowed out of exchanges, indicating potential accumulation.
  • Despite the ongoing price correction, 65% of top traders appear to be taking long positions on SUI.

SUI coin appears to be garnering significant attention from traders and investors, as its value holds above the key support level of $3.83 despite market uncertainty. Moreover, SUI’s price action and on-chain metrics indicate that the asset has the potential to soar significantly in the coming days.

Market Sentiment and SUI Coin Price Momentum

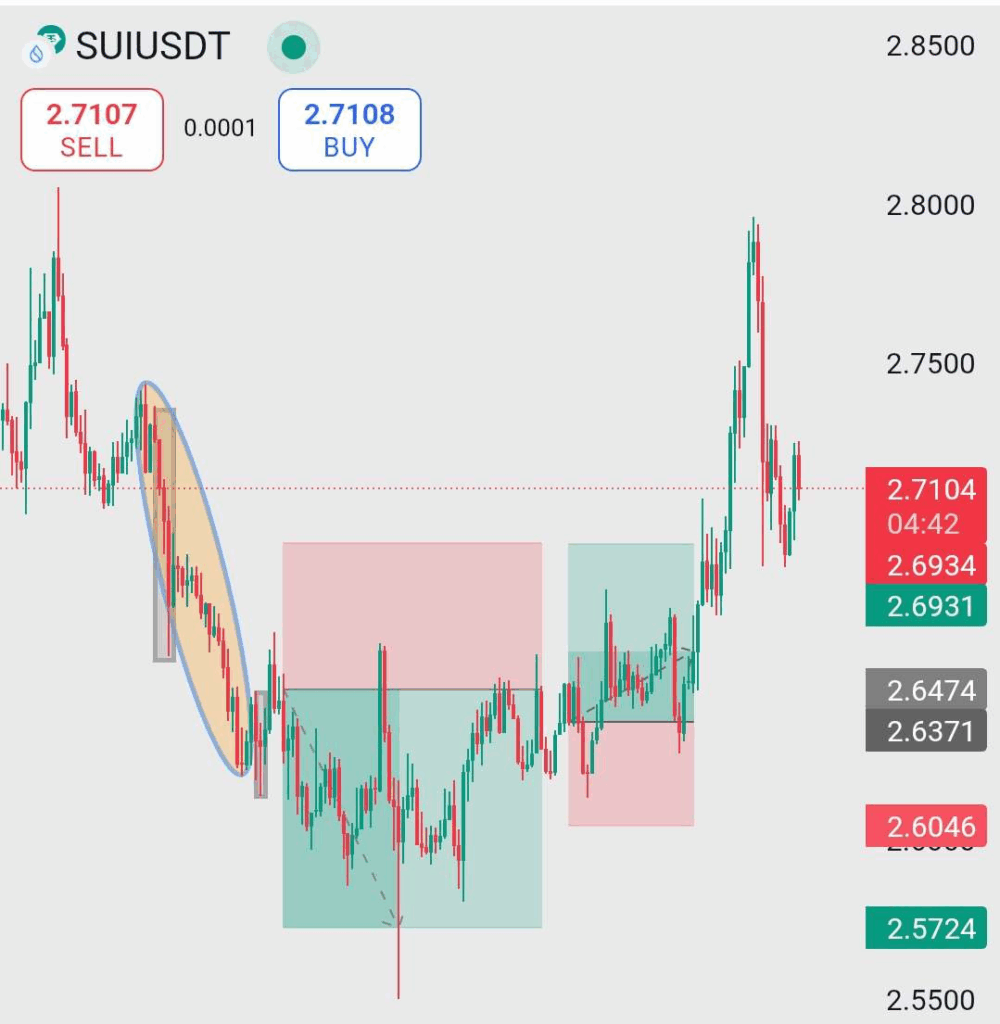
At press time, SUI coin was trading near $3.93 and had registered a price surge of over 6.5% in the past 24 hours. This surge strengthens the asset’s bullish outlook and has led to increased participation from traders’ and investors’.

According to recent CoinMarketCap data, SUI’s 24-hour trading volume has surged by 7.5% compared to the previous day. This surge in trading volume, along with the rising price, indicates that the strength of the asset is strong and that it could continue its momentum in the coming days.

SUI Price Action and Upcoming Levels

According to the TradingView chart, the the SUI coin price appears bullish and is on the verge of a a massive upside rally.

On the daily timeframe, it has been observed that the SUI coin price has been consolidating in a tight range between $3.80 and $4.20 for an extended period.

SUIUSDT Daily Chart
SUIUSDT Daily Chart | Source: CoinGlass

With the recent dip, the asset has reached the lower boundary and is currently witnessing upside momentum.

SUI Coin Price Prediction

Based on recent price action and historical patterns, if the SUI coin price maintains or holds above the key support level or the lower boundary of consolidation, there is a strong possibility that it could initially soar by 7% until it reaches the $4.20 level.

Moreover, if this momentum continues and the SUI coin price breaks out of the consolidation range, it could pave the way for a massive 30% upside rally in the future.

This bullish speculation could fail if the SUI coin price falls below the $3.80 level and closes a daily candle beneath it. If this happens, there is a strong possibility that it could drop by 23% until the price reaches the $2.87 level in the future.

Moreover, SUI’s Relative Strength Index (RSI) stands at 63, indicating that it is near the overbought area but still has enough room to soar and break out of the consolidation.

Bullish On-Chain Metrics

While examining the on-chain metrics, it appears that traders and investors are seizing the current opportunity, as they have been observed betting on and accumulating the tokens, according to the on-chain analytics firm CoinGlass.

$13.70 Million Worth of SUI Outflow

Data from the spot inflow/outflow reveals that experts across the crypto landscape have observed an outflow of over $13.70 million worth of SUI coins over the past 24 hours.

SUI Spot Inflow/Outflow
SUI Spot Inflow/Outflow | Source: CoinGlass

This substantial outflow from exchanges indicates potential accumulation and could lead to buying pressure and an upside rally.

65% Traders Go For Long Postions

Meanwhile, traders are closely following the current price recovery, as they have been strongly betting on the bullish side. At press time, the Binance SUIUSDT long/short ratio stands at 2.65, indicating strong bullish sentiment among traders. This ratio means that for every 2.65 long positions, there is one short position.

Binance SUIUSDT Long/Short
Binance SUIUSDT Long/Short | Source: CoinGlass

At press time, 65% of traders on Binance are betting on long positions for SUI coin, whereas 35% are on short positions.

When combining these on-chain metrics with the technical analysis, it appears that bulls are dominating the asset, and traders and investors seem to be pushing it to breach the consolidation zone and begin its real rally.

Ethereum Price Prediction: What Happens If ETH Fails to Hold $2,700?

0

Key Insights:

  • Ethereum price prediction for the upcoming days appears to be bullish, as whale and institutional participation have skyrocketed.
  • Experts hint that if the ETH price rises above the $2,700 level and stays there, a massive upside rally could be witnessed.
  • Over the past month, whales, institutions, and long-term holders have withdrawn over 1 million ETH, indicating a bullish signal for Ethereum holders.

Ethereum (ETH) has garnered significant attention from traders and investors after rallying 50% in recent days. With this surge, ETH has reached a key resistance level and is currently consolidating, raising questions about whether this upside rally will continue or if a price correction is on the horizon.

Current Market Sentiment and Ethereum Price Momentum

At press time, ETH was trading near $2,591, having recorded a price surge of over 2.10% in the past 24 hours.

This is the level where the asset has been consolidating for the past few days and is near a strong resistance area of the $2,700 level. Historically, whenever ETH reaches this level, it faces rejection and downside momentum. The current consolidation near this point is raising concerns that history may repeat itself, potentially triggering another move to the downside.

Looking at the price action and the repetition of historical patterns, participation from traders and investors has plummeted. According to recent data, ETH’s trading volume has dropped by 15% over the past 24 hours.

When linking the decline in trading volume with the rise in price, it appears that the asset’s momentum is weak, indicating that this consolidation is likely to continue over the next few days.

Expert Bullish View and Ethereum Technical Analysis

Besides all this, a prominent crypto expert recently made a post on X (formerly Twitter), noting that nearly 1 million ETH have been withdrawn from exchanges in the past month, a potential reason behind ETH’s 50% upside rally.

Additionally, the expert shared another post noting that ETH is currently trading below the 200-day SMA (Simple Moving Average) on the 3-day chart, indicating that the long-term trend remains bearish.

The post further mentioned that historically, whenever ETH closes a candle above the 200-day SMA on the 3-day chart, it often experiences a massive rally, something that has occurred multiple times in the past.

This time, the price is approaching the 200-day SMA, which is near the $2,700 level. If ETH maintains its upward momentum and holds above this level, it could witness a significant rally. Experts and analysts are closely monitoring this zone and consider it a strong buy signal.

Ethereum Price Prediction

In addition to the expert’s post, the TradingView chart reveals that the Ethereum price prediction for the coming days appears bullish. The daily chart shows that the asset has already broken above the 200-day Exponential Moving Average (EMA) and is now awaiting a consolidation breakout to resume its upward rally.

ETHUSDT Daily Chart
ETHUSDT Daily Chart | Source: TradingView

Based on recent price action and historical patterns, if the ongoing correction ends and ETH breaks out of consolidation with a daily candle close above the $2,750 level, the Ethereum price prediction could turn bullish. There is a strong possibility that ETH could soar another 50% to reach the next resistance around the $4,100 level.

On the other hand, the Ethereum price prediction could turn bearish only if ETH breaks down from the consolidation and falls below the 200-day EMA. If this happens, ETH could see a 10% price drop, potentially reaching the next support level at $2,160.

Pi Network Price Dips 40%: Profit-Taking Or More Losses?

0

Key Insights:

  • After a 200% rally, the Pi Network (PI) price plummeted by over 40%, raising questions about whether it’s due to profit booking or market sentiment.
  • Binance, the world’s largest crypto exchange, has hinted at listing the Pi coin.
  • Pi Network has launched a $100 million venture to fund startups building real-world applications.

PI attracts strong interest from traders and investors as markets experience a correction. Speculation about a possible listing on Binance is fueling the excitement.

In addition, the Pi Network price recently witnessed a substantial 200% rally. However, it is now experiencing profit booking, which has led to a price correction.

Pi Network Price Momentum and Current Sentiment

Pi Network price has dropped more than 40% in the last 48 hours. It has returned to a level previously surpassed during its recent rally. At press time, PI was trading near $0.89, recording a price decline of over 5% in the past 24 hours.

Amid the ongoing correction, trader and investor participation in PI has plummeted, resulting in a 40% drop in trading volume.

On May 16, 2025, the crypto market experienced downward momentum, and Pi Network was no exception. The asset’s price decline is sparking debate about its cause. Some see it as simple profit booking, while others fear it signals a larger crash ahead.

Pi Coin Price Action & Technical Analysis

According to the TradingView chart, the Pi Network price is still bullish. It is retesting the breakout level of $0.80, which it recently surpassed during its upside rally.

The asset suggests it could soon resume its upward momentum on the daily time frame. However, it is currently undergoing a correction influenced by significant assets like Bitcoin (BTC) and Ethereum (ETH).

PIUSDT Daily Chart
PIUSDT Daily Chart | Source: TradingView

Based on recent price action and historical patterns, Pi Network will likely maintain its upside potential. This could be seen if it holds the key support level at $0.80.

If the asset holds above its support level, it may soon experience a significant rally. In the coming days, the price could surge by 50% to $1.335 or even 120% to $1.95.

With the ongoing correction, Pi Coin’s Relative Strength Index (RSI) has fallen below the overbought zone. It is now hovering near the neutral territory.

At press time, the asset’s RSI stood at 56, suggesting that the token can resume its upward momentum. However, it is likely waiting for the market to end the correction phase.

Pi Network Venture – Real World Adoption

In addition to the recent price action, Pi Network has garnered attention from the crypto community following a major announcement.

On May 14, Pi Network announced the launch of Pi Network Venture on X (formerly Twitter). This fund aims to support startups and businesses that use Pi coin or operate within the Pi Network ecosystem.

Source: X
Source: X

As part of this initiative, the network has allocated a $100 million fund. This will be distributed to businesses or startups either in USD or in PI tokens. This development highlights Pi’s real-world utility beyond just mining.

Is Pi Coin Listed on Binance?

Meanwhile, another post by Binance has garnered significant attention from Pi enthusiasts. Binance posted a crypto-themed version of its logo on Facebook. It jokingly claimed that developers created the design with no artistic sense.

At first glance, it appeared to be just the logo. However, upon zooming in, viewers noticed that it comprised hundreds, if not thousands, of Pi symbols forming the Binance logo.

Following this post, Pi enthusiasts went wild, flooding the comment section and speculating about a potential Pi listing on Binance.

Pi Network price momentum remains strong amid recent developments. Speculation about a Binance listing could trigger the next big rally.

PEPE Coin Price Soars As Whale Activity Jumps 340%: Rally Ahead?

0

Key Insights:

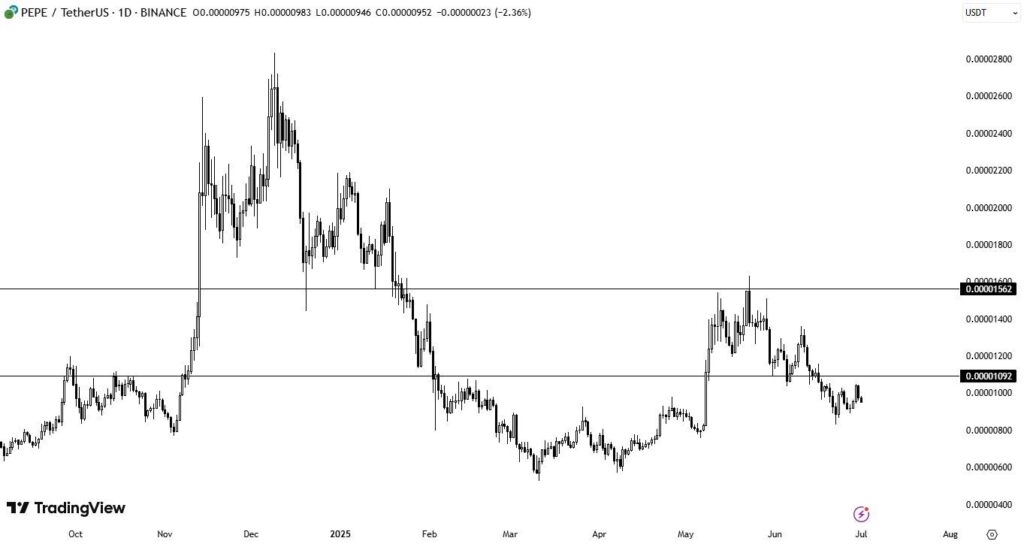
  • PEPE coin price prediction depends on the $0.000013 level; if it fails to hold, PEPE could drop to the $0.000011 level.
  • Investors are seizing the current opportunity and accumulating. The latest data shows $34.70 million worth of PEPE outflows from exchanges.
  • Whale and institutional participation in the meme coin has skyrocketed, indicating a bullish signal.

PEPE coin price prediction is crucial during this correction phase. The chart suggests a possible downward trend. On-chain metrics indicate a potential price increase.

Different perspectives emerge from price action and blockchain data. Traders must weigh both signals to anticipate the next move.

Current Market Sentiment and PEPE Coin Price Momentum

At press time, PEPE coin price was trading near the $0.00001314 level. The token has recorded a price drop of over 6.25% in the past 24 hours.

The price decline is likely due to a correction after a strong rally. The meme coin is nearing a key resistance level, affecting market sentiment.

Traders and investors have reduced participation as sentiment shifts. As a result, trading volume has dropped by 16% during this period.

PEPE Price Action and Technical Analysis

According to the TradingView chart, the PEPE coin price prediction depends on the current support level of $0.000013. Per the daily chart, the meme coin has already faced resistance at a key level of $0.000015.

Historically, this level has acted as an area of selling pressure, causing downside momentum, and it is happening again. Previously, when PEPE’s price reached this level, it witnessed a sharp fall followed by continuous downside momentum.

PEPEUSDT Daily Chart
PEPEUSDT Daily Chart | Source: Trading View

If PEPE coin price drops below $0.000013, its price trend could turn bearish. This could lead to further downward momentum. It could see a price decline of over 13% until it reaches the next support level at $0.000011.

PEPE coin must break above $0.000015 and close a candle above that level to turn bullish. If it succeeds, the price could rally more than 40% in the coming days.

The next resistance level is at $0.0000216, which could be the new target. A decisive breakout could push the meme coin even higher.

Besides this bullish and bearish speculation, PEPE’s RSI stood at 71, indicating that it is in an overbought area. The memecoin may keep dropping until the RSI dips below the overbought zone. After that, it could start rallying again.

Bullish On-Chain Metrics

Traders and investors are showing optimism as participation surges. On-chain analytics tools, Coinglass and IntoTheBlock, confirm this rising activity.

Whale transactions between $100K and $1M have jumped 291.09% in the past week. Similarly, transactions ranging from $1M to $10M have spiked by 340%.

Whales Participation Skyrockets
Whales Participation Skyrockets | Source: IntoTheBlock

Large whale transactions indicate strong interest and confidence in the meme coin. This activity has fueled speculation about a possible price rally.

At the same time, exchange data shows significant movement in the PEPE coin. A total of $47.34 million worth of PEPE has flowed out of exchanges.

PEPE Spot Inflow/Outflow
PEPE Spot Inflow/Outflow | Source: Coinglass

Such outflows from exchanges in the current market conditions indicate potential accumulation. This can create buying pressure and fuel a further upside rally.

When combining these on-chain metrics, it appears that bulls continue to dominate the meme coin, hoping it will sustain its upside momentum.

BTC Mining Profitability Surges 182%—Echoes of 2023 Bull Run?

0

Key Insights:

  • BTC miner profit spread reaches 182%, matching January 2023 levels.
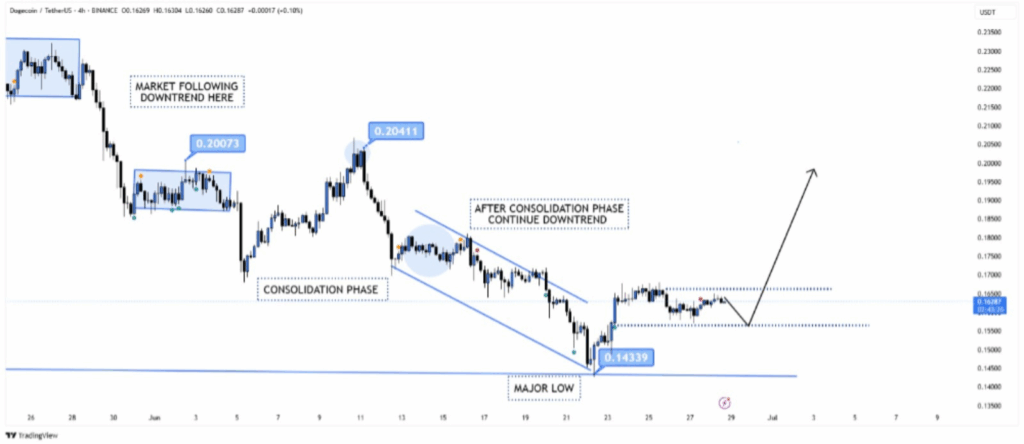
  • $6B in new USDT fuels market liquidity, Tether cap hits $150B.
  • New buyer RSI holds at 100, but momentum trader interest remains low.

Bitcoin miners are earning 182% profit because BTC is trading much above the $36.8K production cost. In addition, $6B in new USDT coming into the market and robust demand from new buyers are backing BTC’s price growth as it hits important continuation zones.

Miner Margins Expand as Production Cost Rises to $36.8K

Miners are once again making money from mining Bitcoin. CryptoQuant reports that it takes $36,800 on average to mine 1 BTC right now. Because Bitcoin is trading over $100,000, the profit spread is 182%. This is the same level of profitability as at the beginning of the 2023 bull cycle.

Bitcoin miner estimated production cost
Bitcoin miner estimated production cost | Source: CryptoQuant

The production cost matters a lot for miners’ financial health. Miners are able to earn more profit when prices rise above this level. We are seeing the same thing now as we saw in late 2022 and early 2023. At that time, miner profits went up a lot and played a role in supporting a long rally.

The chart as of May 2025 shows that miners have gotten past the effects of the April halving. At that point, profitability went down for a short time, but the price increase since then has restored spreads to cycle highs. Should this trend go on, miners could become buyers instead of sellers, which might help prices stay steady.

Tether Adds $6B in Liquidity—Fuel for BTC and Altcoin Demand

Stablecoin inflows are also rising. Over the past 20 days, Tether (USDT) has put $6 billion of new money into the market. The overall market cap of Tether is $150 billion right now. This money is usually held as a reserve for trading in both Bitcoin and altcoin markets.

BTC USDT market capitalization
BTC USDT market capitalization | Source: CryptoQuant

The information indicates that market allocation is changing. The share of Bitcoin in the market has gone down a bit, with Ethereum and other assets getting more focus. As USDT is being invested in altcoins as well, it means the market is growing beyond just Bitcoin.

Even so, BTC is the preferred starting point for a lot of traders and funds. More USDT being issued is usually connected to higher demand for cryptocurrencies. If this trend keeps going, it might support higher prices and trading volumes in all markets, particularly with more liquidity entering exchanges.

Demand from First-Time Buyers Stays Strong While Momentum Slows

Glassnode’s on-chain data shows that the number of new buyers is staying the same. The RSI for the total supply bought by new Bitcoin users has stayed close to 100 during the past week. This means many new buyers are interested in BTC, even when prices are at record levels.
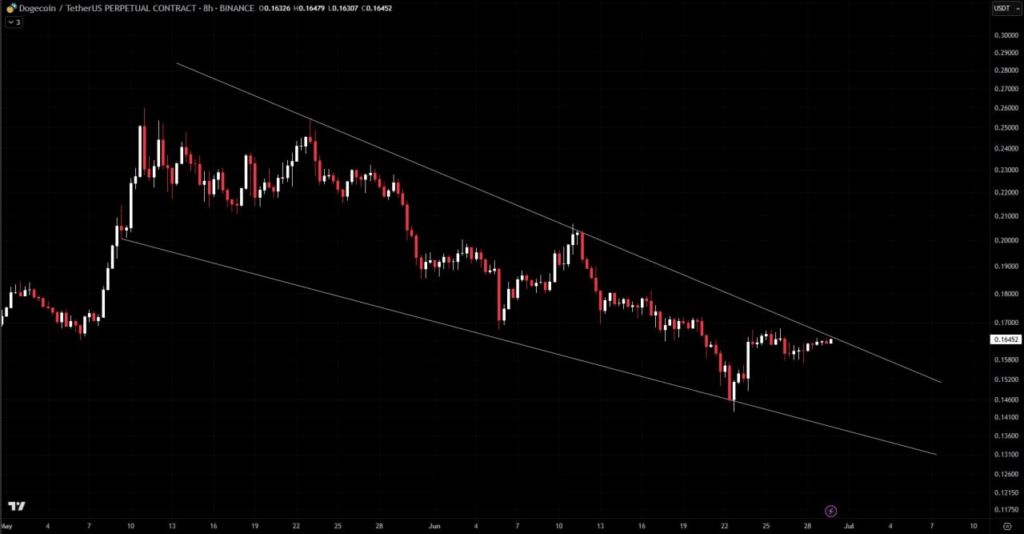
BTC RSI of cumulative supply
BTC RSI of cumulative supply | Source: glassnode

On the other hand, momentum buyers are not very active. With their RSI still at 11, it shows that short-term traders have not come back in force. At the same time, there is a rise in selling for profits. This shows that even though new money is coming in, the rally may not be able to rise sharply because of weak buying pressure.

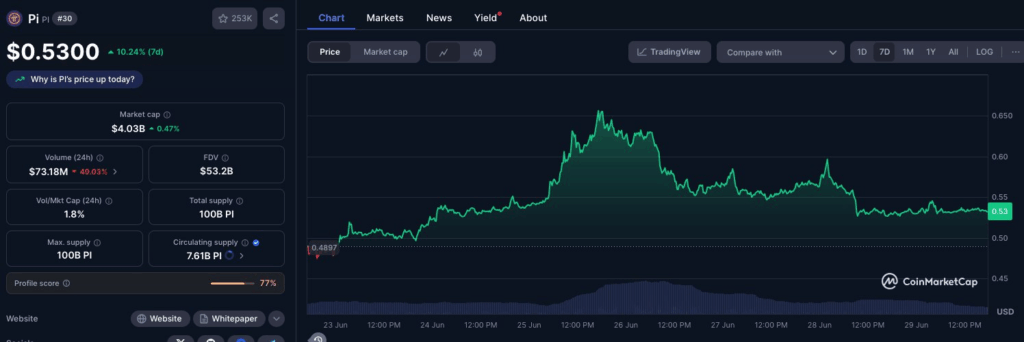
Investors may want to see more proof before returning with strong buying. Should new investors stop coming in, or if selling for gains increases, the rally might stop or settle into a period of consolidation.

Price Structure Points to Continuation—But With Caution

Technical analysis points to Bitcoin being in a stage where the trend continues. As per Gert van Lagen’s chart, Bitcoin has finished a re-accumulation stage and is now in Stage 2.4. Trend Continuation. Weekly closure above $109,400 is what would confirm the trend.

bitcoin price chart
Source: X

The model also has specific levels that would invalidate the trend. A weekly close below $79,000 would, according to the model, end the trend continuation setup.

A longer period between breakouts than the last accumulation period could cause the pattern to become less reliable. This pre-tension period is important and may decide where the market goes next.

Price action up to now fits the model as expected. Should the bulls keep up their momentum, the next breakout could be a new high. But, if sellers take profits or momentum stays low, the pattern could move into a re-distribution range, as the model shows.