
Key Insights:
- Crypto analyst Master Ananda predicts that Solana (SOL) could be on its way to $620 or even $1,020 by early 2026.
- Solana’s recent 24% price correction from $188 to $141 may be ending, with the formation of a higher low on the daily charts.
- Technical indicators like the 50-day and 200-day SMAs and a 14-day RSI show mild bearish pressure, and opportunity for bullish control.
Solana might be on track for a massive price rally straight up to $620 or even $1,020, according to crypto analyst Master Ananda.
While recent market ups and downs have caused a correction in Solana’s price, technical indicators show that the worst may be over. If current trends hold. Here’s why Solana may be ready for a major comeback by early 2026.
Solana’s Current Market Position
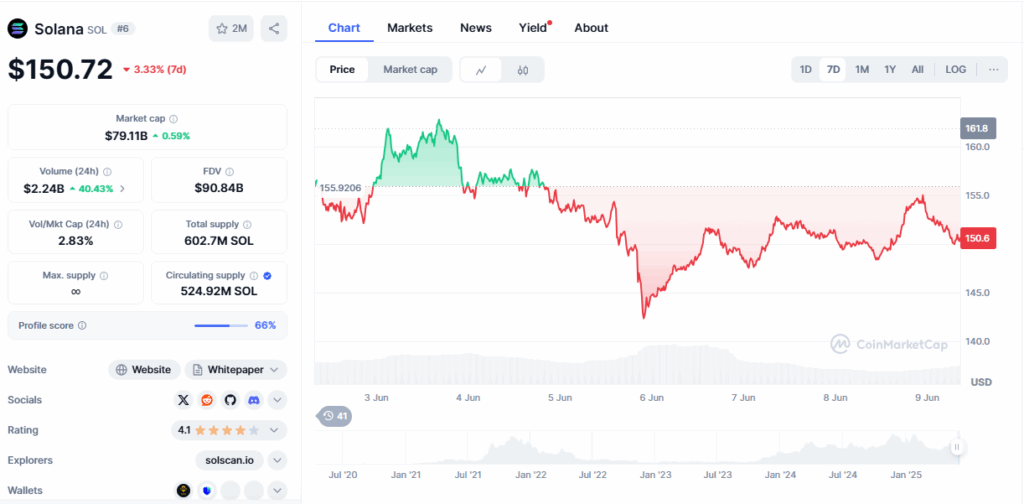
At the time of writing, Solana has a current price of around $149.52, after recovering slightly from a recent dip to $141 from last week. While the cryptocurrency is currently trading red on the daily timeframe, it is still outperforming many other cryptocurrencies in the top 100.
Earlier this year, SOL reached as high as $188, before declining by around 24%. This drop has raised some interesting questions about whether the rally is over.
However, analysts like Master Ananda believe that this pullback could actually be setting the stage for a larger upside move.
According to Solana’s charts, the technical outlook is mixed. However, there are signs of strength here and there.
For examople, Master Ananda pointed out the 50-day Simple Moving Average, which sits at $161, alongside the 200-day SMA is at $164.19.
These figures indicate that while SOL is facing some short-term resistance, a breakout above could end the short term sluggishness and trigger fresh momentum.
Moreover, the 14-day RSI is currently 40.14, which shows that the bearish pressure is mild. It also indicates that Solana hasn’t entered oversold territory yet, which gives bulls a great opportunity to regain control.
This setup has analysts watching closely for a “higher low” formation, which could be a confirmation that the correction phase is ending.
The Fibonacci Blueprint
According to Master Ananda, the Fibonacci extension levels are showing some interesting price levels for Solana. For example, the 1.618 Extension around $420 is considered the minimum bullish target.
If Solana were to reach and break above this level, it would show that the market is regained some strength.
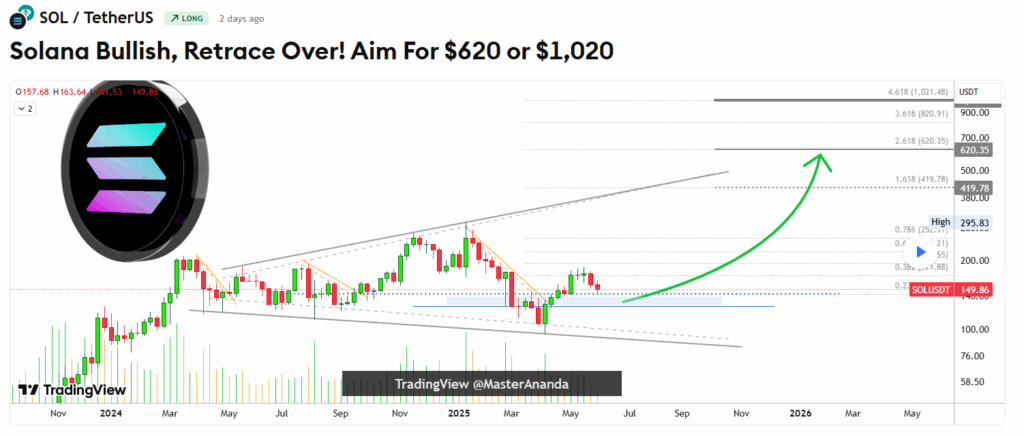
In addition, the 2.618 Extension around $620 is seen as the main target. This means that a move to this level would be the perfect indicator of bullish momentum and investor confidence.
Moreover, the 4.618 Extension around 1,021 serves as the extended bullish scenario. This would require a longer-term breakout if Solana maintains its uptrend and the general market conditions remain favorable. These levels aren’t merely speculation. They are instead based on previous price action and retracement behavior.
The recent 24% correction has created what now looks like a higher low on the chart. If confirmed, this could be a turning point that launches Solana toward these bullish targets.
A Realistic Timeline
If this bullish scenario plays out, Master Ananda believes that Solana could hit $620 by January 2026. This would stands as a 316% increase from current prices.
In addition, at a current price of $620, Solana’s market cap would reach approximately $325 billion. This price tag would bring the cryptocurrency closer to Ethereum’s current standing, especially if Ethereum continues its slow growth.
In fact, some believe Solana could challenge Ethereum’s dominance in DeFi and NFTs if this trend continues. Overall despite the optimism, Master Ananda warns traders not to short during a bull market, considering how sudden reversals can quickly wipe out gains.
To top things off, Solana’s dip from $188 to $141 may have already run its course. And if a new higher low is established, the stage is set for a bullish breakout over the coming months.