
Key Insights:
- Alpha and True Market Mean Price models show support near $64,700.
- CVDD Channel points to another major support area of around $66,300.
- Altcoins may rally through November even if Bitcoin remains under pressure.
On-chain models show clustered support at $64.7K – $66.3K, meaning that Bitcoin’s price is still at risk of falling below $65,000.
Short-term weakness is still present, but altcoin season projections are still valid, and a run into late 2025 is possible.
Key Support Levels Cluster Near $65K
Several long-term valuation models point to a potential support zone for Bitcoin between $64,700 and $66,300.
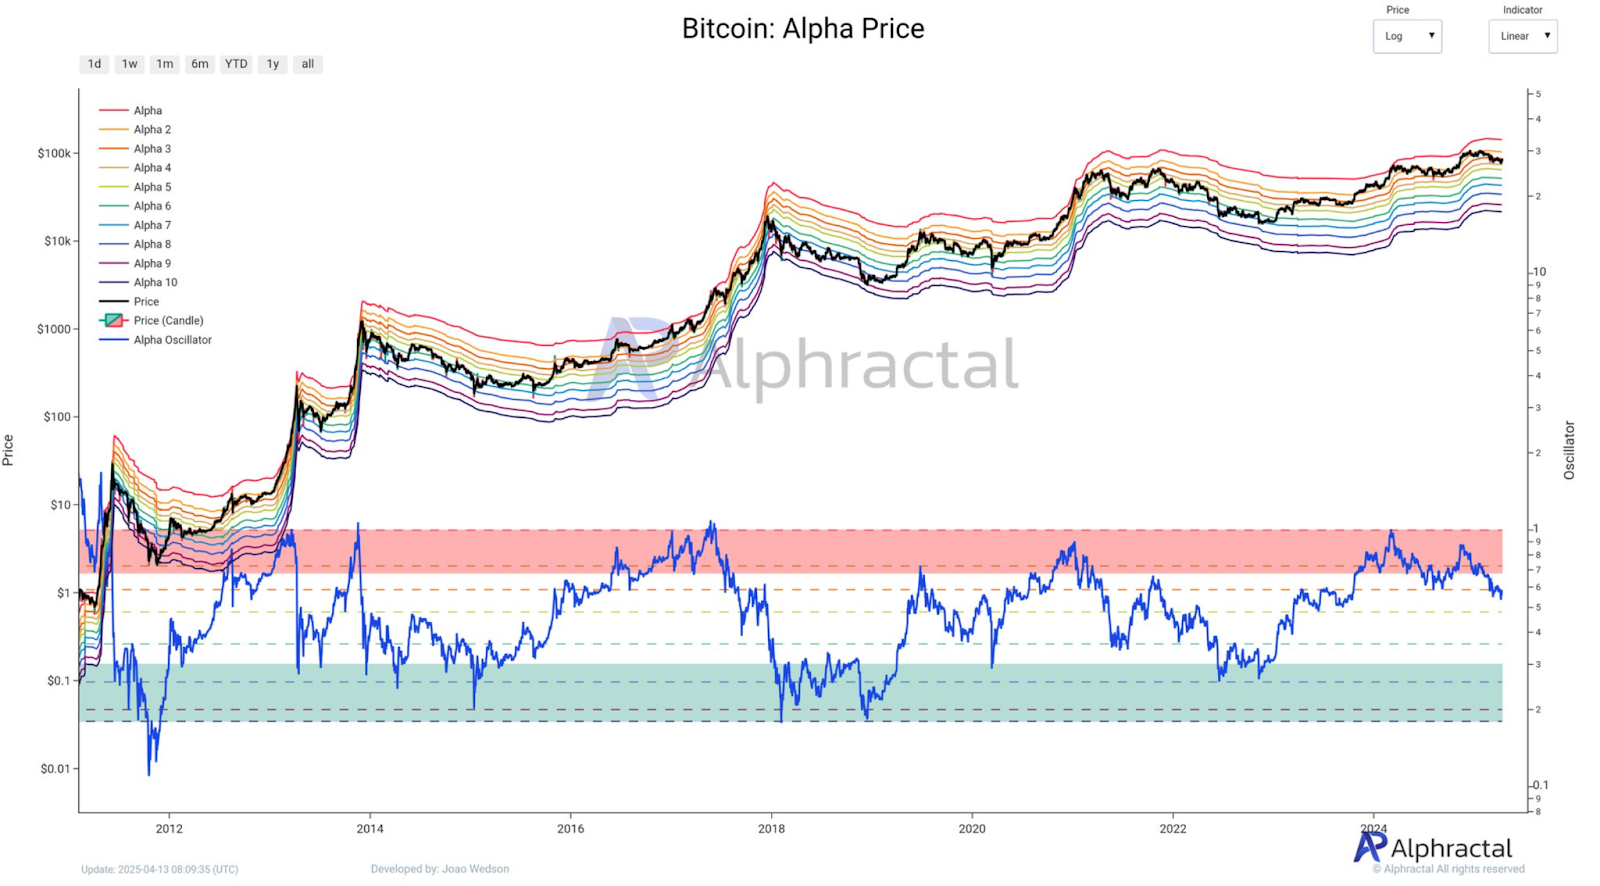
The Alpha Price Model is a layered band structure that reflects price cycles and its Alpha 6 band, a key mid-range support, is around $64,700.
Previously, Bitcoin’s price has bounced from similar levels and continued to trend higher.
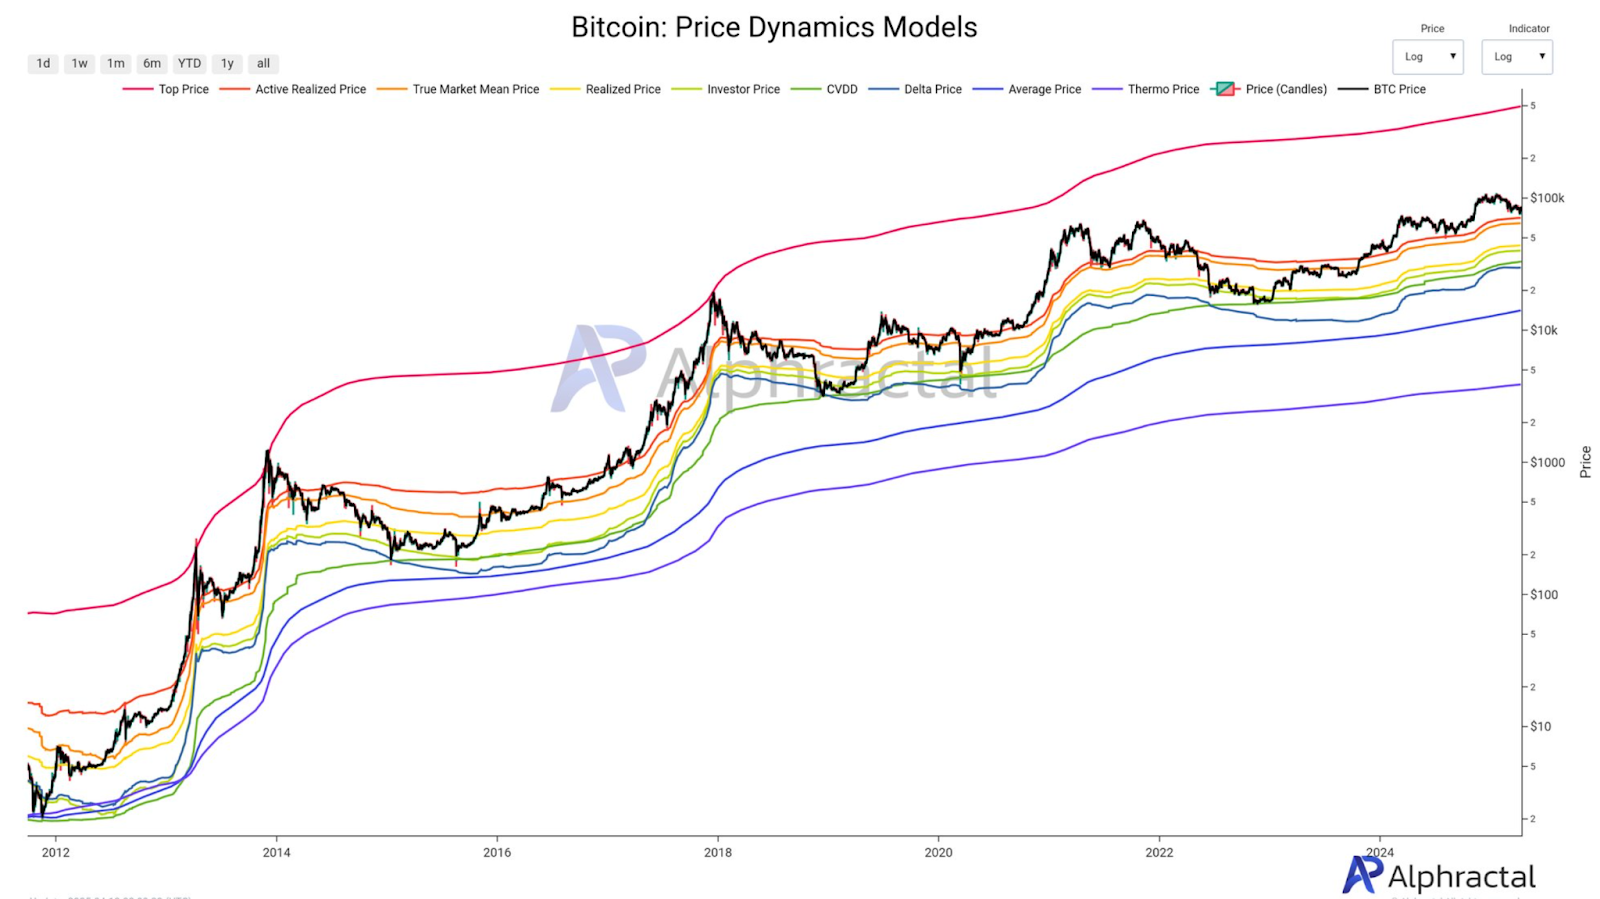
The True Market Mean Price in the Price Dynamics Models chart reinforces this figure. This model, which tracks the average cost basis over time, is also $64,700.
This area overlaps with the values of the other two indicators, which suggests that this area might be a key decision point for price direction.
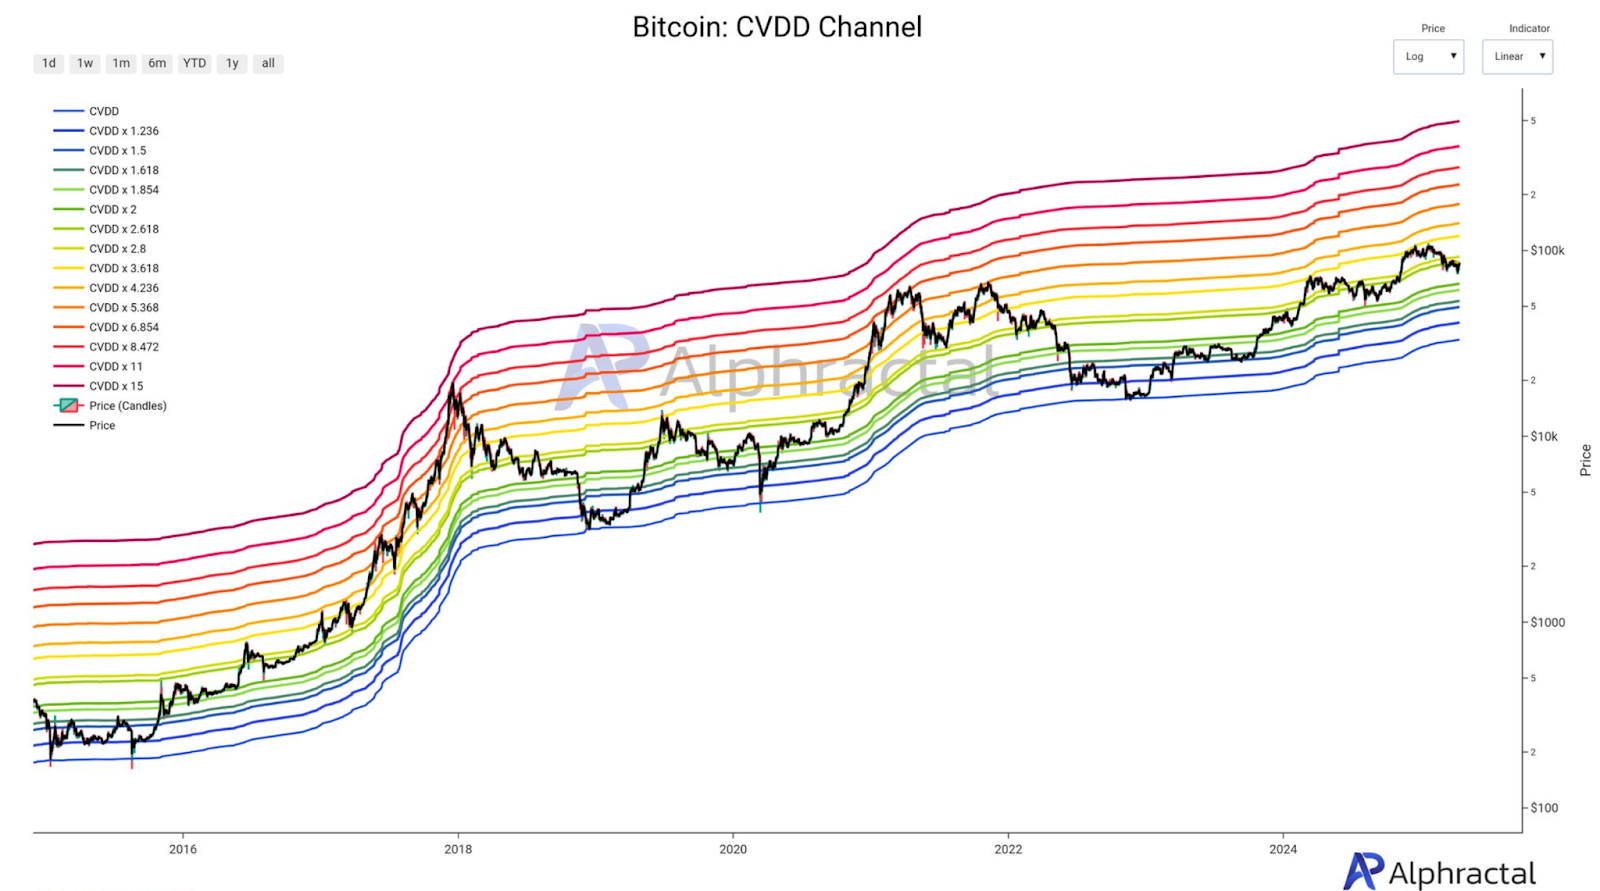
Furthermore, the CVDD Channel, another long-term valuation tool, has the CVDD x 2 band near $66,300. This band has served as a dynamic support zone in the past.
Should that level fail, the model has the CVDD x 1.854 band near $61,000 as the next major support.
These zones are time-weighted coin destruction values which represent long-term holder conviction.
Active Market Support Found at $70.2K
Longer-term support is closer to $65K, while shorter-term behaviour revolves around $70,200.
The Active Realized Price is the current value of that, which is the average cost basis of coins that have been actively traded.
Throughout 2024, this level has been tested repeatedly, but it has not broken down completely.
This is important because many recent buyers are holding positions near this level.
If the price stays above it, it means that the selling pressure from the recent market participants is still limited.
Usually, if the price stays above the active realized price, it means that short-term investors are in a better sentiment.
But the Alpha Oscillator, a sentiment and momentum tool plotted on the Alpha Price chart, is on a downward slope.
The momentum is fading as the oscillator is currently below the neutral zone.
The drop often precedes temporary corrections, which means that the price may move towards the $65K region.
Investor Behavior Suggests Redistribution is Likely
Recent on-chain trends indicate that Bitcoin may be in a redistribution phase. Indicators on the STH & LTH Sentiment Price Bands chart support this.
At press time, the price was oscillating between the ‘Anxiety Band’ and the ‘lower Optimism Band’.
These levels have been precedents to periods of sideways movement, as they have been points where traders become uncertain.
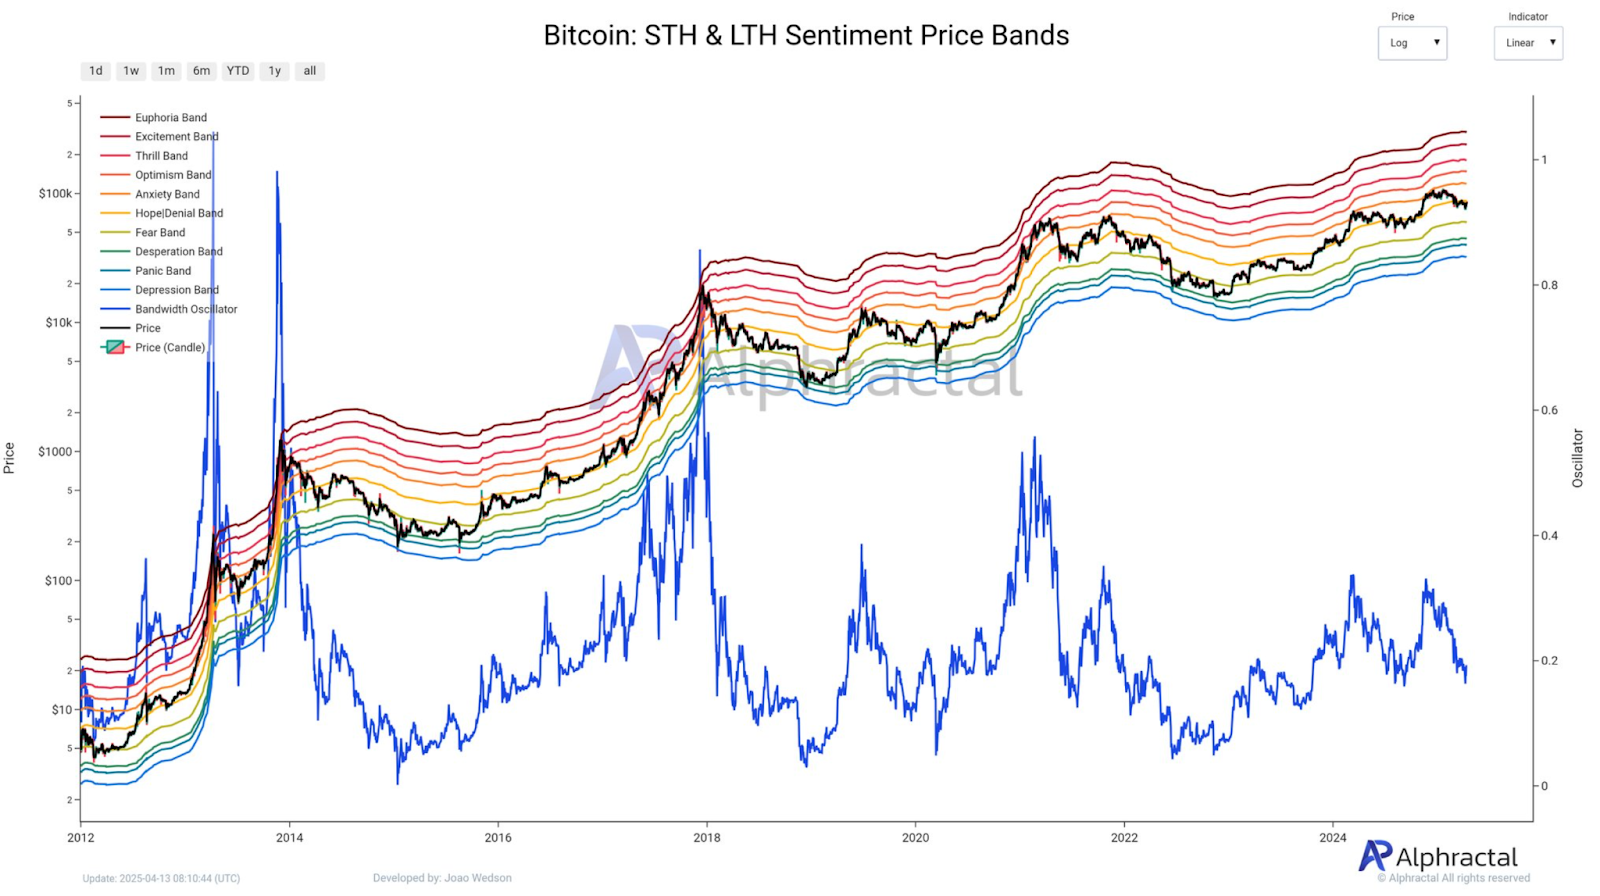
The blue line is the Bandwidth Oscillator, which has also declined.
This oscillator is based on price volatility across sentiment bands and often contracts before large directional moves.
Mid-level sentiment combined with a fall in bandwidth indicates indecision rather than confidence.
However, data also shows that miners and short-term holders are distributing. These groups frequently sell into rallies to make profits.
Therefore, the current market does not show strong accumulation behaviour, which means the price cannot go up from here until stronger buying reappears.
Altcoin Performance Outlook Remains Unchanged
Even with Bitcoin’s price being volatile, Alphractal analysts are still projecting a Bitcoin cycle peak around mid-October 2025 with altcoin momentum continuing through November or even December.
This pattern is based on past cycles where altcoins tend to perform after Bitcoin tops.
It may already have been a soft correction to the recent drop to $74K.
However, several indicators are starting to indicate early signs of sentiment recovery, but are still below optimal levels.
If Bitcoin doesn’t break down from the $70K range, it could present an opportunity for new accumulation.
A crypto analyst Joao noted that, even if the price does not fall any further, $74K is already a decent correction, referring to historical pullbacks before large upward moves.
While some altcoins have seen a buildup in long positions, especially in those with high exposure, newer assets are still gaining attention.
If speculative demand goes up, these can rise independently of Bitcoin.