
Key Insights:
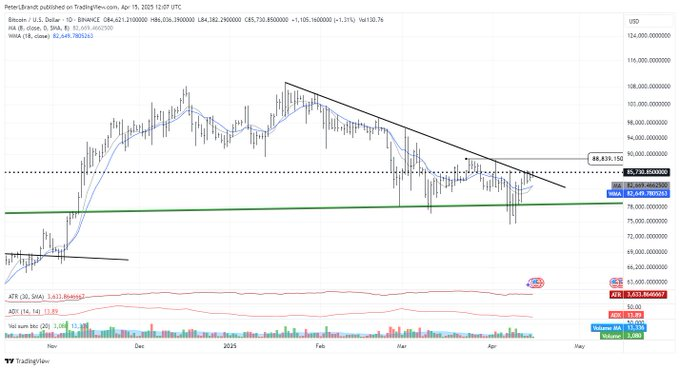
- Bitcoin recently broke above a descending trendline that had held for three months, reaching a high of $86,450.
- At press time, the price was trading at $83,889.86, reflecting a 24-hour drop of 0.75%.
- Despite the breakout, technical analyst Peter Brandt dismissed the trendline breach as insignificant to the overall market direction.
Bitcoin (BTC) recently moved above a major descending trendline, gaining renewed attention from market watchers and retailers across the space.
The price jump created a new short-term high, briefly pushing the asset to $86,450 within the daily trading window.
However, seasoned market participant Peter Brandt dismissed the breakout’s importance, labeling the trendline breach insignificant.
Bitcoin Breaks Key Trendline but Lacks Convincing Confirmation
Bitcoin broke above a three-month-long descending resistance, sparking optimism among traders hoping for a prolonged uptrend.
The breakout followed a period of extreme fear, particularly when Bitcoin dipped to $75,000 just days prior.
BTC price has demonstrated weak continuous movement following its resistance breakout, implying that full support for the rise is still lacking.
The trading price at the time of writing this piece was $83,889.86 with a 0.75% daily drop. The price reflected a weak market recovery after the breakout.
The daily trading prices oscillated within the range of $84,353 to $86,450 indicating moderate market turmoil without any definitive directional shift.
The price movement lacks the necessary trading volume to confirm accumulation based on the price structure observed.
Financial expert Peter Brandt did not recognize the technical breakout and considered it unimportant.
According to him, trendlines have little significance and cannot prove market reversals. The most dependable asset support and resistance signals appear as horizontal price areas.
Bitcoin Indicators Show Weak Bullish Signals
The Relative Strength Index (RSI) was at 52.66, showing neutral characteristics in the market with modest buying indications.
The RSI moving average currently stands at 45.78, which verifies a price increase that began when the March decline reached its lowest point.
The indicator indicates possible price growth yet demonstrates limited buying pressure since it lacks strong overbought signal strength.
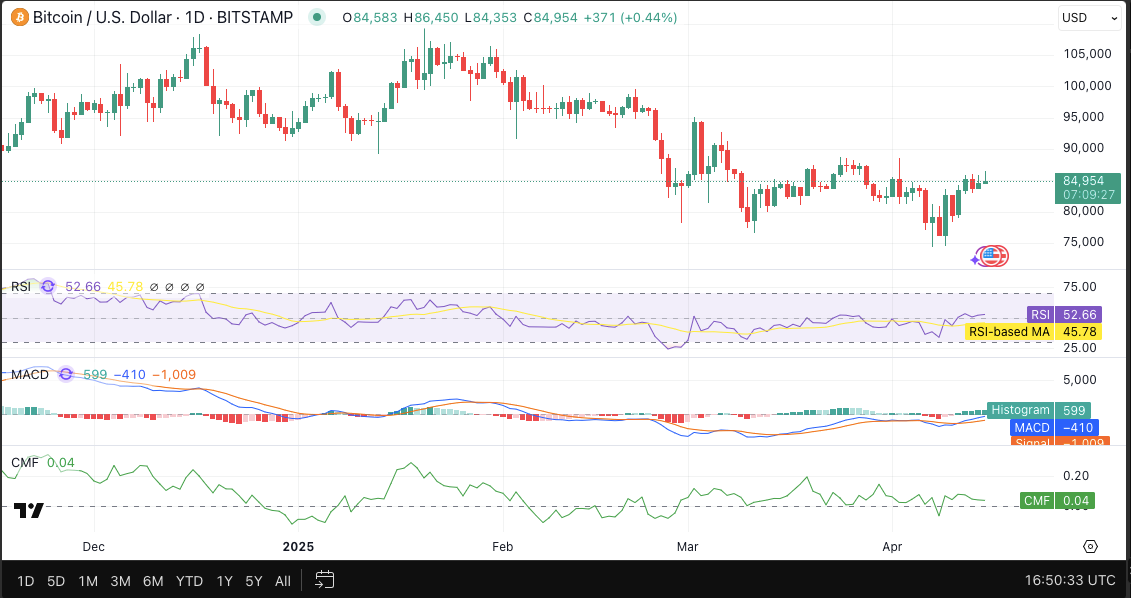
The Moving Average Convergence Divergence (MACD) line crossed above the signal line, thus indicating a potential start of bullish market movement.
The MACD reading was 599, while the signal line maintained its position at -1,009, which verifies the crossover signal.
According to the overall histogram development, price strength remains restrained so far.
Market capital inflows show a mild increase, as indicated by the Chaikin Money Flow (CMF) value of 0.04.
The data shows accumulation activity is taking place, but buying strength stays at a minimum level.
Without strong inflows or trading volume spikes, Bitcoin’s momentum remains uncertain despite breaching the trendline.
Bitcoin Ratio Shows Balanced Trader Sentiment
The BTC Long/Short Ratio has remained mostly balanced in recent sessions, consistently hovering around the 1.0 level.
The trader split between bullish and bearish expectations remains balanced because there is little dominance from either side.
All market components adapt their positions according to both price movements and macroeconomic data signals.
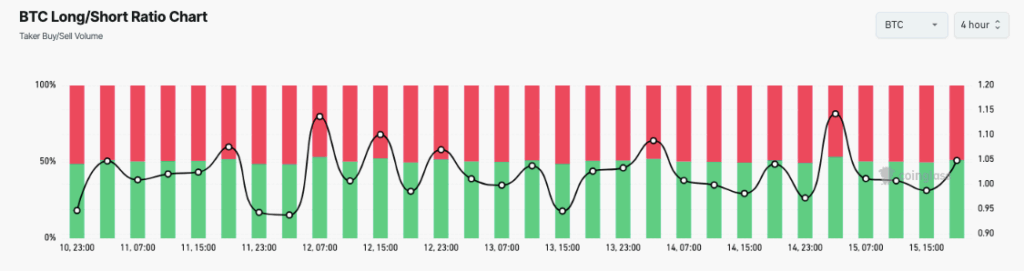
The current data indicates that long positions at 1.05 exceed short positions by 0.05 according to the Long/Short Ratio calculation during the fourth hour.
The market showed two previous movements above 1.10 on April 12 and April 14 but exhibited sharp price drops afterward.
Most of the bulls demonstrate limited sustainability in their positions, combined with regular short-term trading that leads to profit-taking across the market.
The market has exhibited hesitation regarding heavy long exposure after its upward breakout.
These shifting sentiments within leveraged positions reflect market-wide insufficient investor confidence.
Price stability showed no sign of long-lasting control from either support or resistance.
The market action may stay within current consolidation or retracement zones during the near future.
Brandt’s criticism of the trendline’s significance challenges the current bullish enthusiasm seen across social channels.
Brandt argued that only horizontal levels offer dependable insights into future price movements.