
Key Insights:
- Solana dropped nearly 5 percent before rebounding to $132.60, testing key support around the 20-day EMA.
- A bearish right-angled ascending broadening pattern has formed, with a potential downside target of $65 based on technical analysis.
- Despite the breakdown, Solana gained 5.16% on April 16, signaling short-term buying strength and renewed interest.
Solana price recently slipped, challenging a key technical level and signaling potential downside risks. SOL managed a modest rebound after trading below the 20-day EMA.
However, analysts have pointed to troubling patterns. Despite signs of short-term buying pressure, bearish indicators and technical breakdowns raise concerns about its next move.
Solana Faces Bearish Breakdown as Analyst Signals $65 Target
Solana declined nearly 5% within 24 hours, dropping to $123.72 before rebounding to close at $132.60. This volatility placed SOL at a pivotal support level, the 20-day EMA, around $123.90.
The support level was an essential indicator for potential downtrend initiation after a clear price drop below it. A bearish pattern known as a right-angled ascending broadening formation can now be observed through technical charts.
The price chart showed that a decrease would occur after breaking the lower trendline while trading near the $127 area.
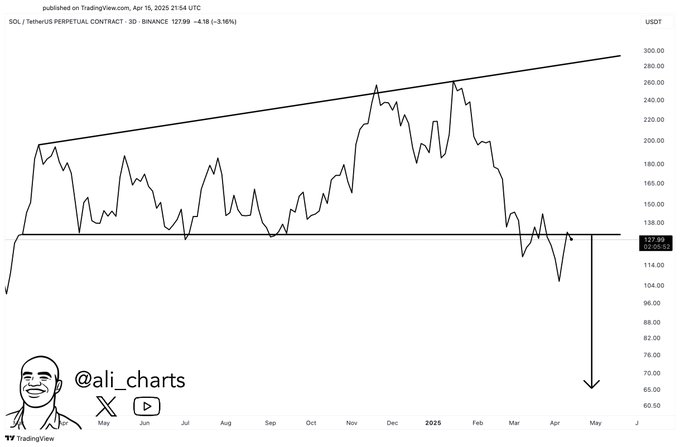
Analysts who apply pattern analysis believe that SOL should drop to $65 after breaking down by $95 from its initial level. The pattern project calculation uses the width measurement of the pattern, which ranges between $165 and $260.
The analyst’s warning aligns with the observed $95 difference. This discrepancy stems from the breakdown point at $130. The $65 price point has developed into a prospective long-term bearish objective.
Solana Price Climbs Despite Bearish Setup
Despite the bearish setup, Solana recorded a 5.16% gain on April 16, closing at $132.60. Market interest increased during that day. This caused the price to achieve an intraday high of $133.91 while starting at $126.10.
Price surged immediately after reaching its low point at $123.46 while dealing with rising market volume. Momentum indicators revealed a positive trend for the short term because RSI and MACD show rising metrics.
Improved momentum became evident as the RSI reached 54.43, exceeding its typical value of 44.19. Market conditions allow further price growth since the momentum indicators stay below their overbought points.
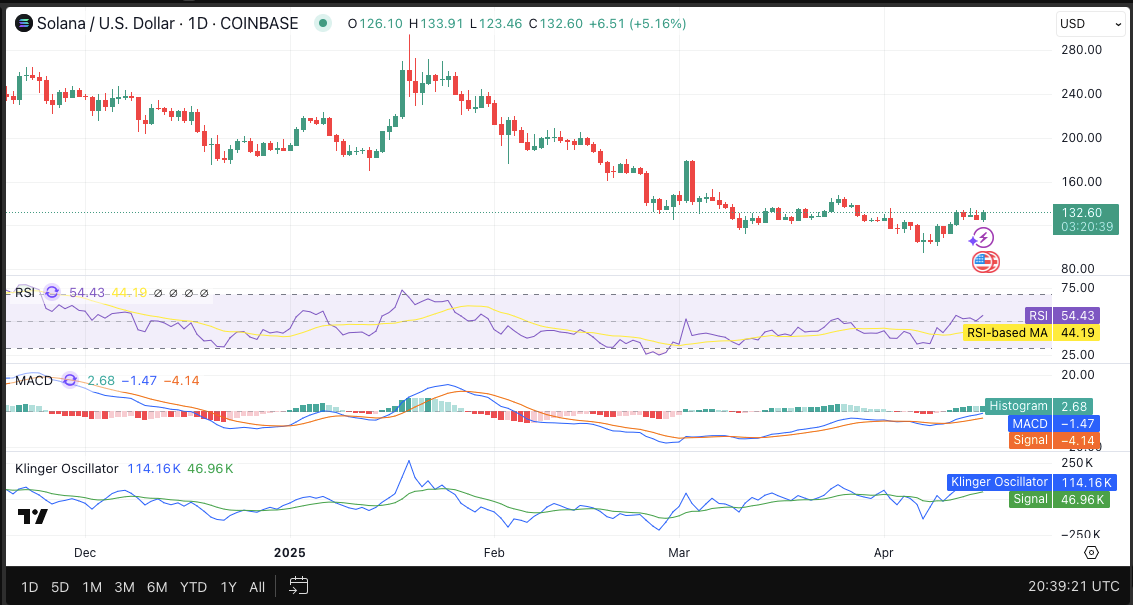
The MACD lines displayed positive values as they crossed the signal lines at -1.47 and -4.14 during each observation. A histogram reading of 2.68 suggests a growing trend in market buying power.
This reflected an increase in market momentum. The Klinger Oscillator reading showed 114.16K points above the signal line positioned at 46.96K.
Solana Faces Resistance Near $144 Level
Janover, a real estate financing firm, added $10.5 million to Solana’s holdings. This purchase raised its total to 163,651.7 SOL, with a total value of nearly $21.2 million.
Public statements from the company indicate considerable stakeholder engagement. They will preserve the tokens based on their long-term business plan. On-chain data from Glassnode reveals that over 32 million SOLs are held, costing around $129.79.
Major holders have concentrated their accumulation at this level, which gives this support strong potential. Another 18 million SOLs were acquired at $117.99, forming a secondary support zone.
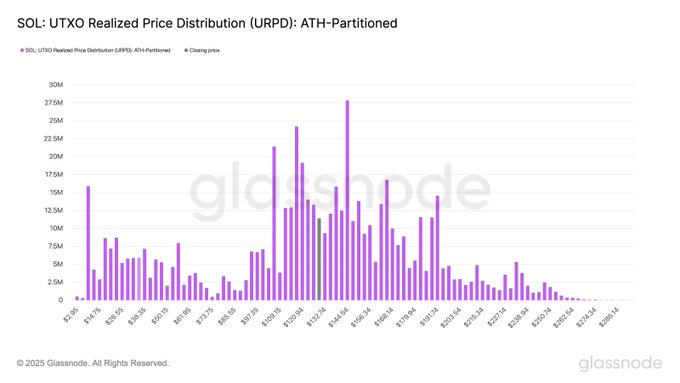
The historical pattern of buying activity suggests resistance has formed near $144 simultaneously, with support standing at $117.
The existing trading zone spans $129 to $12,9, with $129 establishing itself as the central mark. SOL may remain bound within this zone unless a clear breakout occurs in either direction.
Solana NFT Trading Returns in Beta
Solana gained exposure as OpenSea resumed limited token trading support for the blockchain. This new functionality is accessible to specific users, while the vendor plans to add more users progressively.
The combined system will promote improved visibility and increased market liquidity throughout the NFT marketplace.
Market sentiment could shift as OpenSea plans to reintroduce Solana-based NFTs. Implementing this change can potentially attract additional users, driving more participation across the network.
However, the present beta phase prevents immediate business outcomes. The ongoing development initiatives and adoption strategies fail to eliminate technical indicators that influence short-term market dynamics.
The market momentum has changed direction briefly, while descending risks persist after the latest price breakdown. Current market trends indicate traders will use $117 and $129 as their primary reference points for determining short-term price movements.