
Key Insights:
- Dogecoin showed signs of a bullish reversal after recovering from a false break below a critical support level.
- The price remained stable above support for several days, increasing the chances of a strong upward move.
- A symmetrical triangle pattern on the daily chart suggests a breakout may follow the current consolidation phase.
Dogecoin recently showed signs of a potential breakout following a technical rebound above a critical support level.
The asset reversed a downward move after briefly falling below its long-standing trendline.
As momentum builds, analysts observed strong technical indicators that could point toward a significant price rally.
DOGE Holds Support and Eyes Rally
Dogecoin’s daily chart shows signs of a false break, indicating that recent bearish pressure has weakened.
The price of the asset has been in a downtrend from December 2024 until the beginning of 2025, creating lower highs and lower lows.
The downtrend lasted for several months, but it ended when the asset could not keep its price below $0.13.
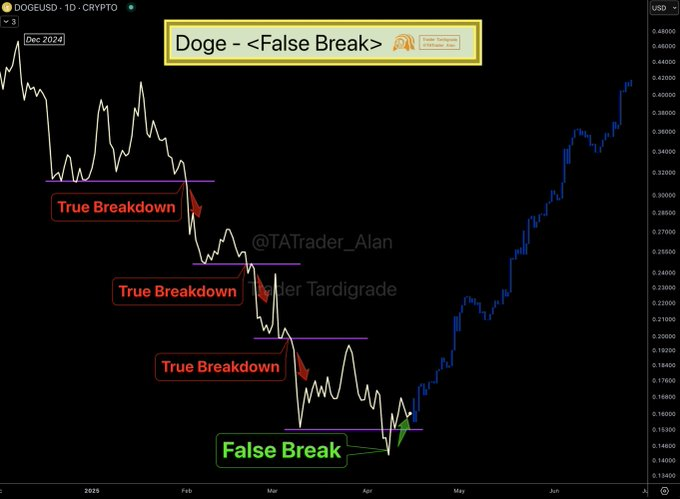
That failed breakdown occurred on April 7, when DOGE sharply dropped before quickly recovering above support.
The price action diverged from previous failures, resulting in reduced market levels.
DOGE continues to sustain the upward bounce from support at multiple points throughout several days, thus reinforcing bullish price expectations.
As a result, this rebound introduces new upside potential for Dogecoin in the coming sessions.
Professional analysts detect a definite weakening of selling pressure through this action.
This positive development has the potential to become the launching point of a future upward market direction.
The earlier breakdowns tracked down by technical expert Trader Tardigrade have consistently resulted in lower price levels.
The fresh market movement ended differently because price recovery happened inside the established trend area.
The failed effort to break below marks the first false breakdown since last December.
This trend formation follows a typical pattern that appears before big bull market advances.
With DOGE still trading above the identified support, confidence in further upside continues to rise.
Analysts predict DOGE will reach $0.42 as its next price target indicating more than 170% expected ascent from existing market rates.
Dogecoin Forms Triangle Pattern Before Breakout
Alongside the false break, a symmetrical triangle pattern adds further weight to bullish forecasts on Dogecoin.
The asset has remained within a symmetrical pattern for numerous months as it established a narrow compact space of upper and lower trendlines.
DOGE continues to bounce between resistance and support as momentum builds inside the triangle.
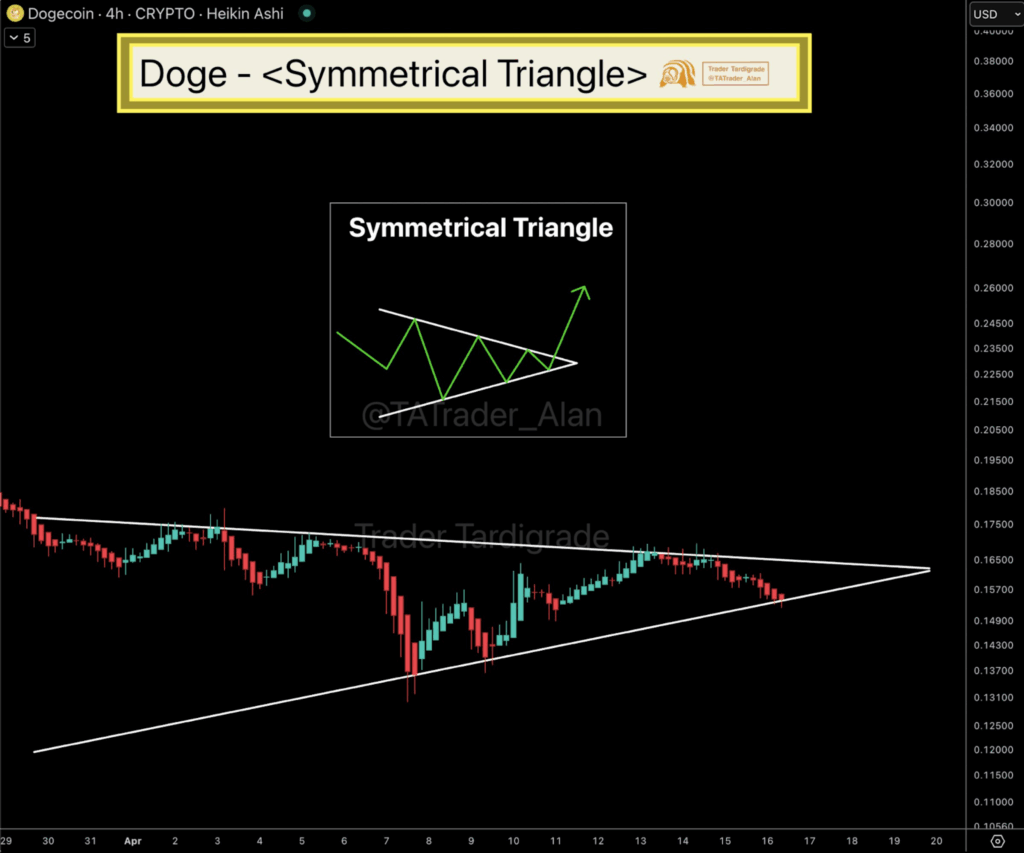
Trader Tardigrade examined this pattern structure during a recent analysis which proved clear price reactions at all triangle limits.
Each time DOGE hits the upper trendline, it retraces; however, dips toward the lower trendline attract buying pressure.
The most recent reaction from the lower boundary shows DOGE attempting another push higher.
Dogecoin’s location within the triangle area enables price movement to stay volatile even though directional movement becomes restricted.
The stronger the breakout outcome becomes according to analysts when this compression period extends longer. DOGE now approaches a point where it must decide its next major direction.
An explosive price change could occur after resistance is broken because the triangle indicates a price compression system.
The market indicates equilibrium because the trading range continues to decrease. A successful break above the resistance point would show the current negative trend is invalid thus establishing a positive price trend.
Because this setup omits specific price objectives it delivers historically strong market movements when traders break out from these patterns.
Internal pressure accumulation within the pattern indicates future market volatility will decrease prior to an expected rise in prices. DOGE remains near the lower boundary and may soon retest resistance again.
DOGE Eyes $0.70 in Rising Channel
A longer-term analysis from FuaCompany introduces a rising channel on Dogecoin’s monthly chart.
This setup shows that DOGE has formed a series of higher highs and higher lows since its bottom.
DOGE price was trading between parallel boundaries, which make up the bullish design of this price structure.
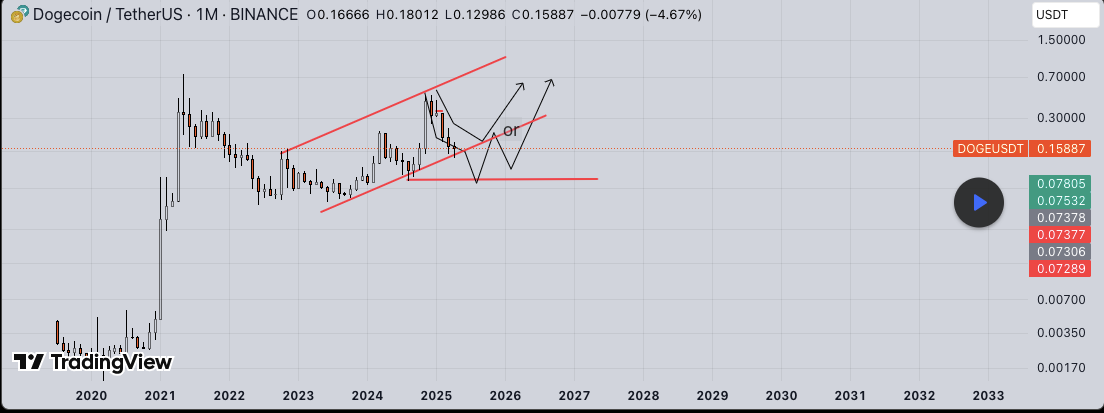
DOGE has respected the lower boundary of the channel multiple times, using it as a launch point for upward moves.
Historical price data indicates that the previous $0.05 support level led to an important market surging upward.
The current positioning near mid-channel leaves room for further upside if the pattern holds.
The positive market conditions outlined by FuaCompany will continue despite the possibility of short-lived price corrections.
Short-term price declines may bring DOGE to $0.08 and the cryptocurrency will probably rebound afterward based on previous patterns.
DOGE may climb toward $0.70 in the longer run, testing its 2021 highs if the channel remains valid.