
Key insights:
- Whale acquires 19,973 ETH at $1,740 using $34.75M borrowed from Aave.
- Bitcoin ETFs saw $912.7M inflows, while ETH ETFs lag with just $38.8M.
- ETH rebounds 10%, triggering bullish chart pattern and whale accumulation.
A major Ethereum whale bought nearly 20,000 ETH as the price jumped 10%, using $34.75 Million borrowed from Aave.
This move follows a strong price rebound and comes as Bitcoin ETFs saw record inflows, though ETH ETFs remain quieter by comparison.
Whale Buys 20,000 ETH Using $34.75M Borrowed from Aave
One of the large Ethereum holders, or whales, has made a big move in the market. The whale borrowed $34.75 Million in USDT from the Aave protocol.
It bought approximately 19,973 ETH at an average price close to $1,740 with the borrowed amount.

On-chain data also reveals that the whale collateralized 50,000 WETH ($89.8 Million) to borrow a total of 65.85 million USDT.
This loan has a health rate of 1.12 with a liquidation price of $1,549.5. This means that if the ETH price falls below this level, the position will be closed forcefully.
This implies strategic positioning at a time of price recovery. The whale levered up their exposure to ETH, leaving some room before they would be liquidated.
U.S. ETFs Record $912.7M BTC Inflows While ETH ETFs Stay Quiet
However, at the same time, Bitcoin saw a spike in ETF inflows to the U.S. market. Total inflows into U.S. BTC ETFs on April 22 were $912.7 Million.
It is the biggest single-day inflow since President Trump took office in 2025. Fidelity (FBTC) was second with $253.8 Million, followed by BlackRock (IBIT) with $193.5 Million.
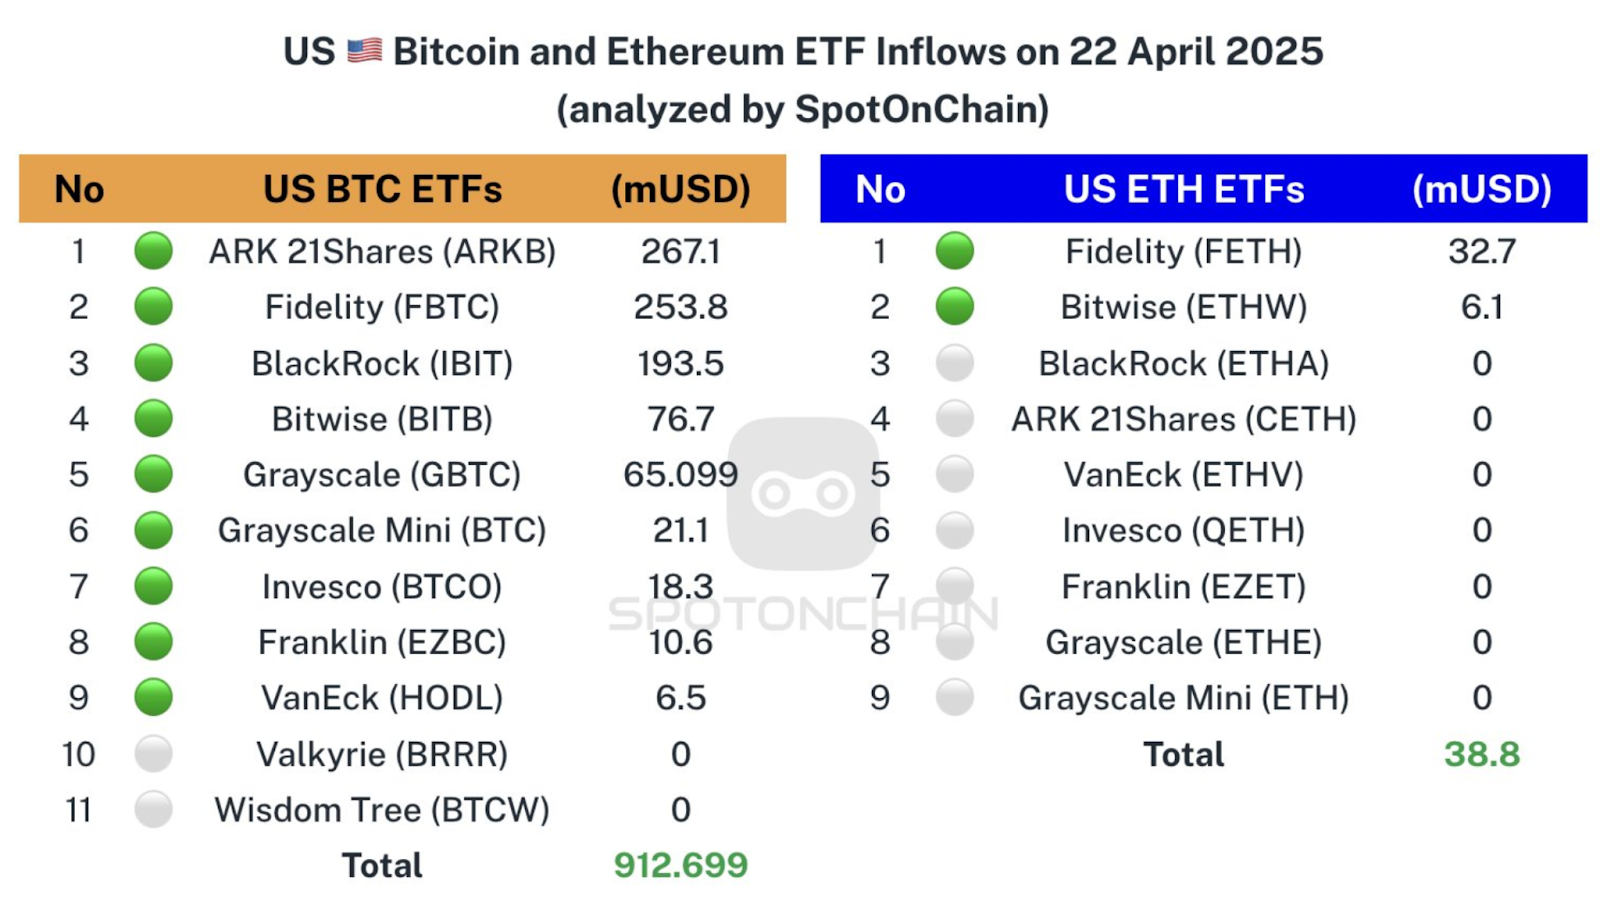
On the same day, Bitcoin saw strong inflows, while Ethereum ETFs only saw $38.8 Million in total. The most was $32.7 Million to Fidelity’s ETH fund. ARK 21Shares, other issuers reported no inflow for their ETH products.
This contrast implies that the institutional attention on Bitcoin is higher than that on ETH, while individual investors are accumulating ETH.
The smaller ETH ETF inflow could be a delayed response or a cautious sentiment from larger funds.
Chart Pattern Suggests Bullish Breakout Potential
On the other hand, a technical analyst shares a long-term chart of Ethereum forming a classic inverse Head and Shoulders pattern.
This is a price formation that implies a reversal from a downward trend. The pattern is made up of two shoulders and a head, and the chart covers several years.
It seems that ETH broke out just after it bounced from below $1,600.
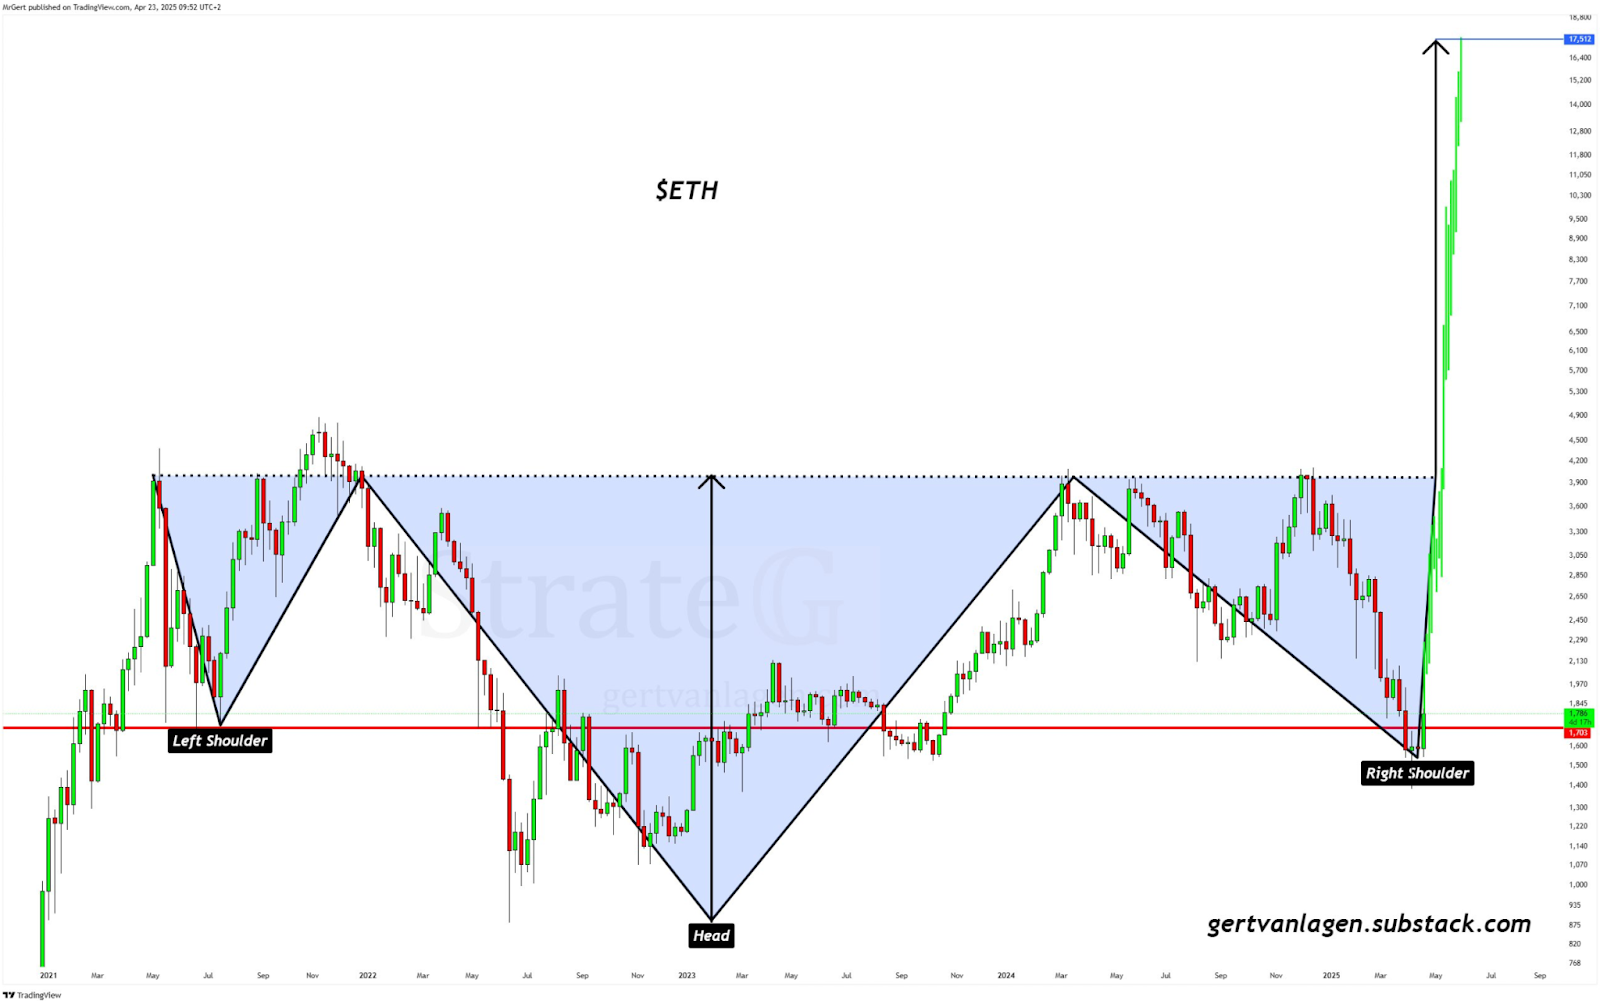
The chart shows this setup aiming at $17,000 in the long term. That figure is not a forecast, but it puts the current structure in context for how traders may be looking at it.
It also reveals how ETH has bounced off key support zones in the past and has then gone on to have a strong upward movement.
Many smaller traders were shaken out during the right shoulder phase, as noted by Gert van Lagen, who shared the chart. It usually occurs before a strong upward move.
Despite Market Momentum, Liquidation Risk Persists
Whale activity, rising inflows into crypto ETFs and technical breakouts all point to strong momentum in the ETH market.
However, the use of borrowed funds involves risk. The whale’s liquidation level is very close to $1,549, just about 10% below the current price.
A drop in ETH could lead to a cascade of liquidations for leveraged positions.
However, the market seems to be bullish for now, and investors are closely watching key price levels.