
Key Insights:
- BTC miner profit spread reaches 182%, matching January 2023 levels.
- $6B in new USDT fuels market liquidity, Tether cap hits $150B.
- New buyer RSI holds at 100, but momentum trader interest remains low.
Bitcoin miners are earning 182% profit because BTC is trading much above the $36.8K production cost. In addition, $6B in new USDT coming into the market and robust demand from new buyers are backing BTC’s price growth as it hits important continuation zones.
Miner Margins Expand as Production Cost Rises to $36.8K
Miners are once again making money from mining Bitcoin. CryptoQuant reports that it takes $36,800 on average to mine 1 BTC right now. Because Bitcoin is trading over $100,000, the profit spread is 182%. This is the same level of profitability as at the beginning of the 2023 bull cycle.
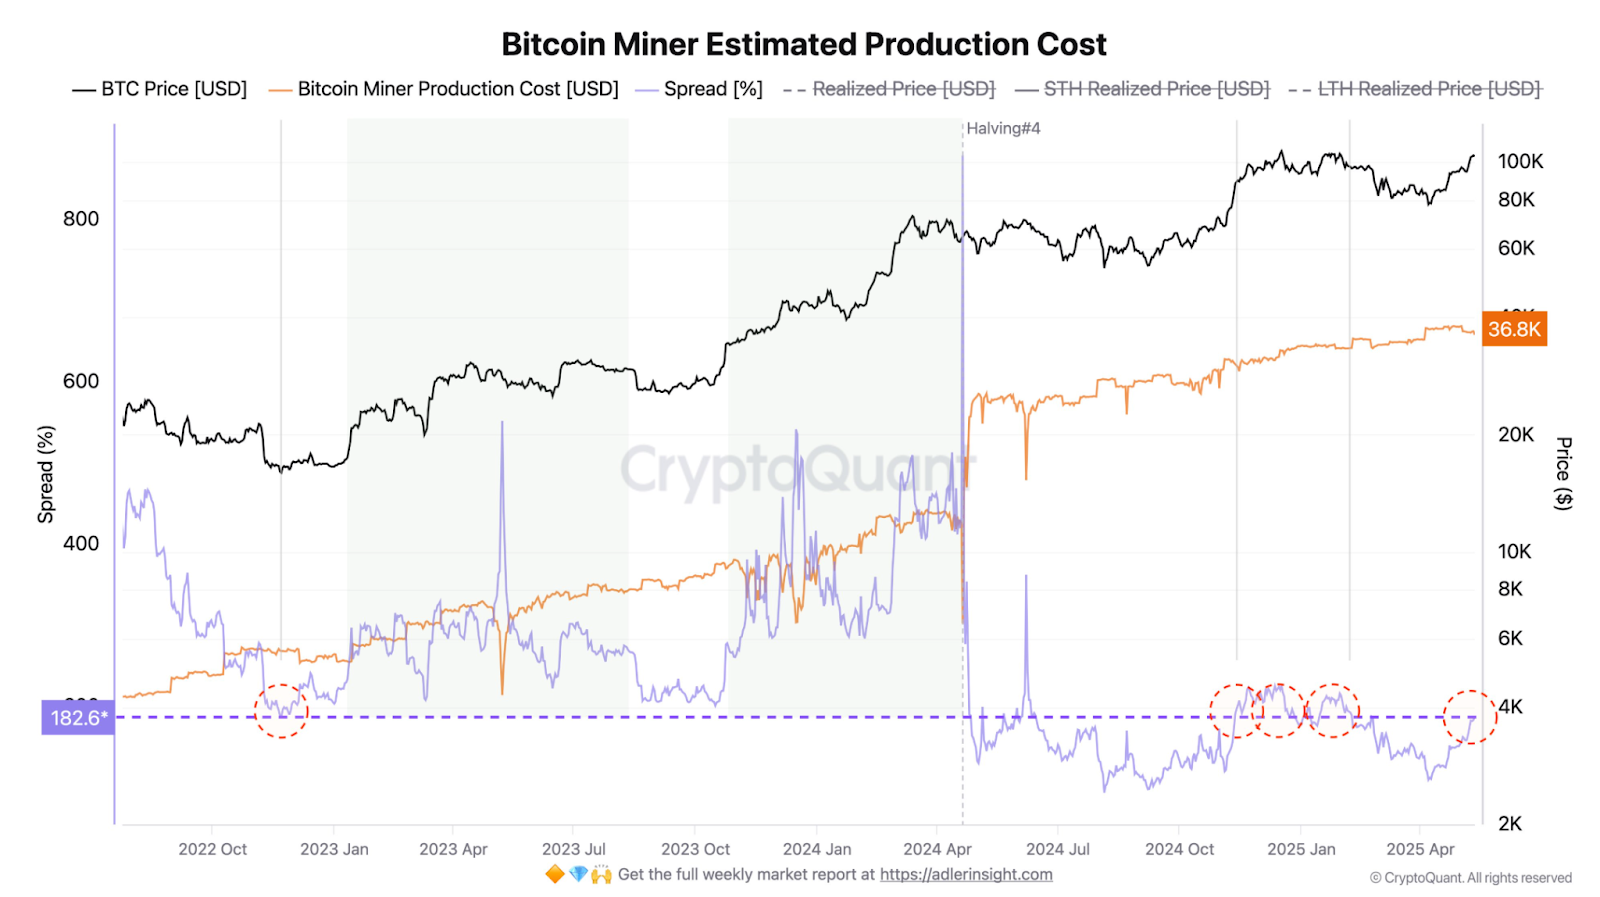
The production cost matters a lot for miners’ financial health. Miners are able to earn more profit when prices rise above this level. We are seeing the same thing now as we saw in late 2022 and early 2023. At that time, miner profits went up a lot and played a role in supporting a long rally.
The chart as of May 2025 shows that miners have gotten past the effects of the April halving. At that point, profitability went down for a short time, but the price increase since then has restored spreads to cycle highs. Should this trend go on, miners could become buyers instead of sellers, which might help prices stay steady.
Tether Adds $6B in Liquidity—Fuel for BTC and Altcoin Demand
Stablecoin inflows are also rising. Over the past 20 days, Tether (USDT) has put $6 billion of new money into the market. The overall market cap of Tether is $150 billion right now. This money is usually held as a reserve for trading in both Bitcoin and altcoin markets.
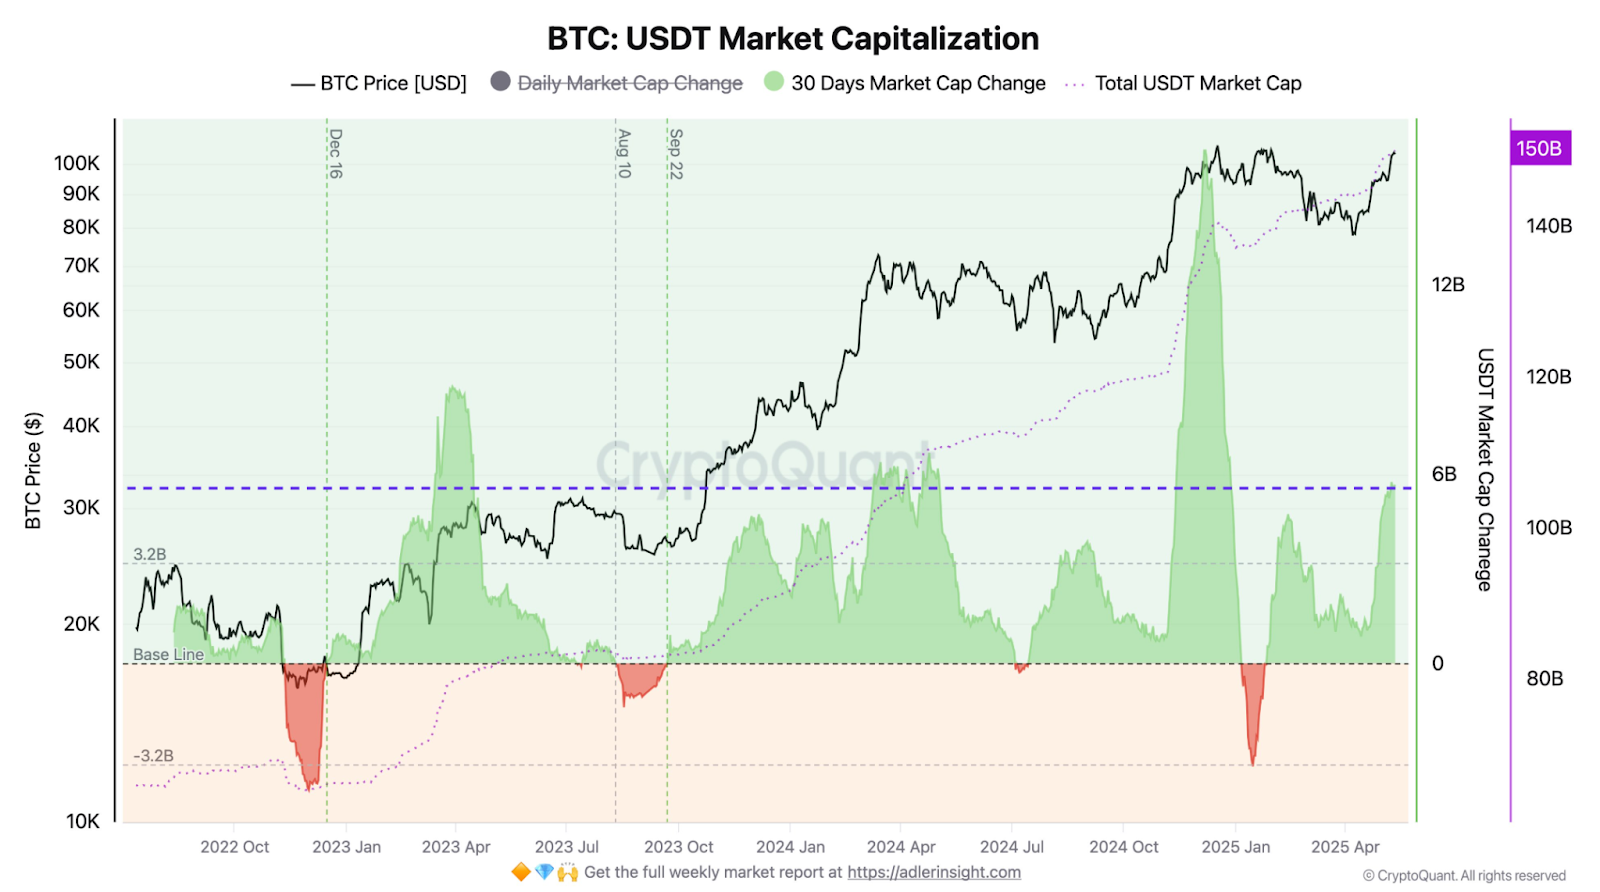
The information indicates that market allocation is changing. The share of Bitcoin in the market has gone down a bit, with Ethereum and other assets getting more focus. As USDT is being invested in altcoins as well, it means the market is growing beyond just Bitcoin.
Even so, BTC is the preferred starting point for a lot of traders and funds. More USDT being issued is usually connected to higher demand for cryptocurrencies. If this trend keeps going, it might support higher prices and trading volumes in all markets, particularly with more liquidity entering exchanges.
Demand from First-Time Buyers Stays Strong While Momentum Slows
Glassnode’s on-chain data shows that the number of new buyers is staying the same. The RSI for the total supply bought by new Bitcoin users has stayed close to 100 during the past week. This means many new buyers are interested in BTC, even when prices are at record levels.
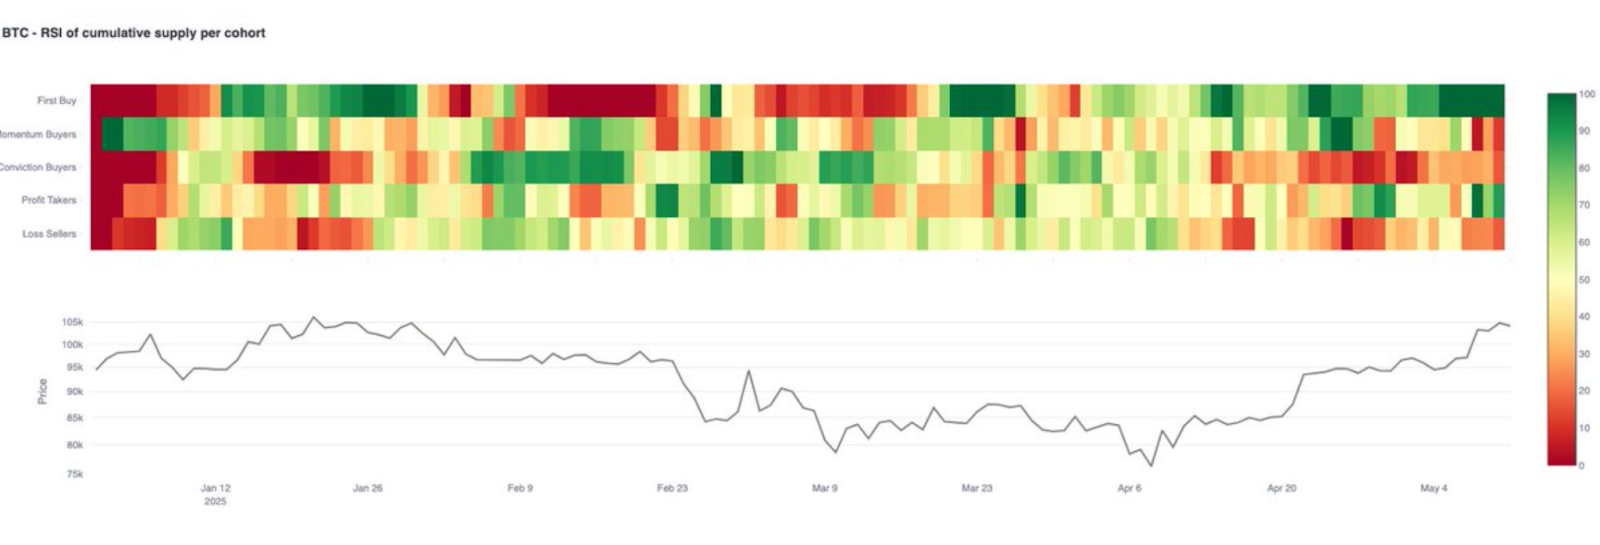
On the other hand, momentum buyers are not very active. With their RSI still at 11, it shows that short-term traders have not come back in force. At the same time, there is a rise in selling for profits. This shows that even though new money is coming in, the rally may not be able to rise sharply because of weak buying pressure.
Investors may want to see more proof before returning with strong buying. Should new investors stop coming in, or if selling for gains increases, the rally might stop or settle into a period of consolidation.
Price Structure Points to Continuation—But With Caution
Technical analysis points to Bitcoin being in a stage where the trend continues. As per Gert van Lagen’s chart, Bitcoin has finished a re-accumulation stage and is now in Stage 2.4. Trend Continuation. Weekly closure above $109,400 is what would confirm the trend.
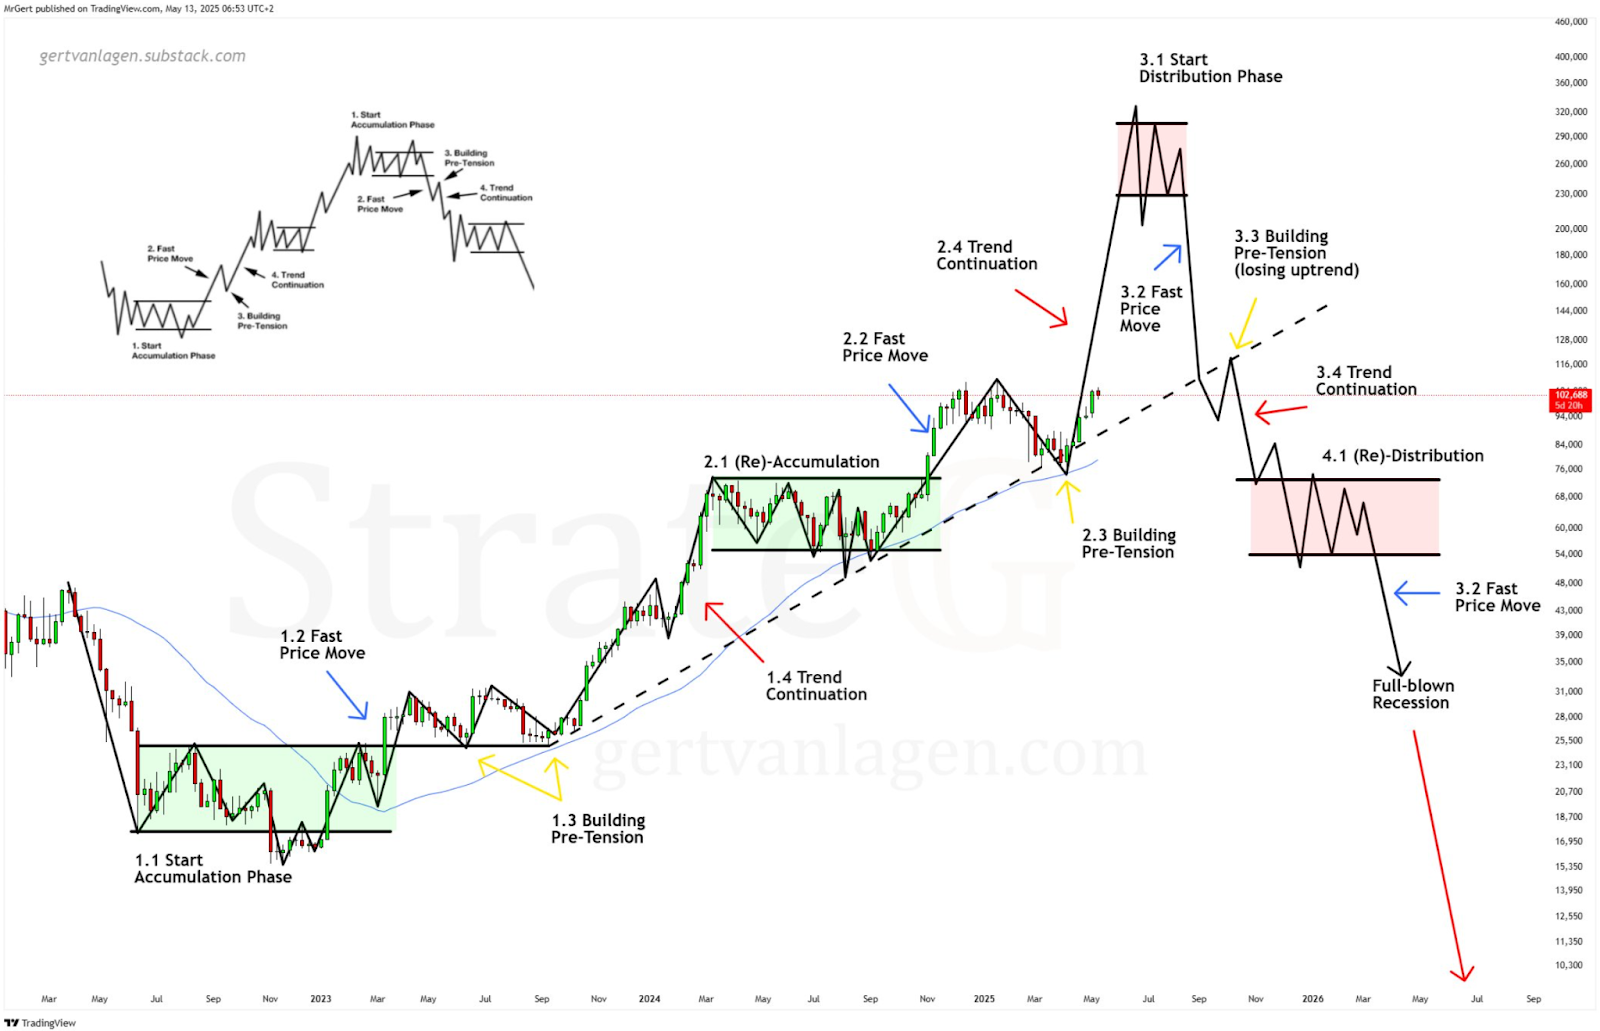
The model also has specific levels that would invalidate the trend. A weekly close below $79,000 would, according to the model, end the trend continuation setup.
A longer period between breakouts than the last accumulation period could cause the pattern to become less reliable. This pre-tension period is important and may decide where the market goes next.
Price action up to now fits the model as expected. Should the bulls keep up their momentum, the next breakout could be a new high. But, if sellers take profits or momentum stays low, the pattern could move into a re-distribution range, as the model shows.