
Key Insights:
- Coinbase Premium Index enters bullish territory at 0.03.
- Realized Cap rises to $906B, reflecting strong conviction.
- Sentiment remains bullish as BTC holds near $104K.
Bitcoin is currently valued at $103, 022 and several indicators are pointing towards a mid-term bullish trend. Recently, the Coinbase Premium Index, which is used to monitor institutional demand in the U.S., has turned positive again. In the past, such actions have often been followed by higher prices, and many investors are now monitoring the situation to see if it happens again.
Meanwhile, market opinions are very optimistic and realized capitalization keeps going up. Although the asset is approaching significant resistance levels, the recent changes show that investors are becoming more confident.
Coinbase Premium’s Price Rises After Being Below Zero for Many Months
The Coinbase Premium Index is currently at 0.03, which is above zero. It shows the gap between Bitcoin’s price on Coinbase which is commonly used by U.S. institutions and the price on Binance and other international exchanges.
If the value is positive, it may suggest that American institutional investors are interested in buying the company’s shares.
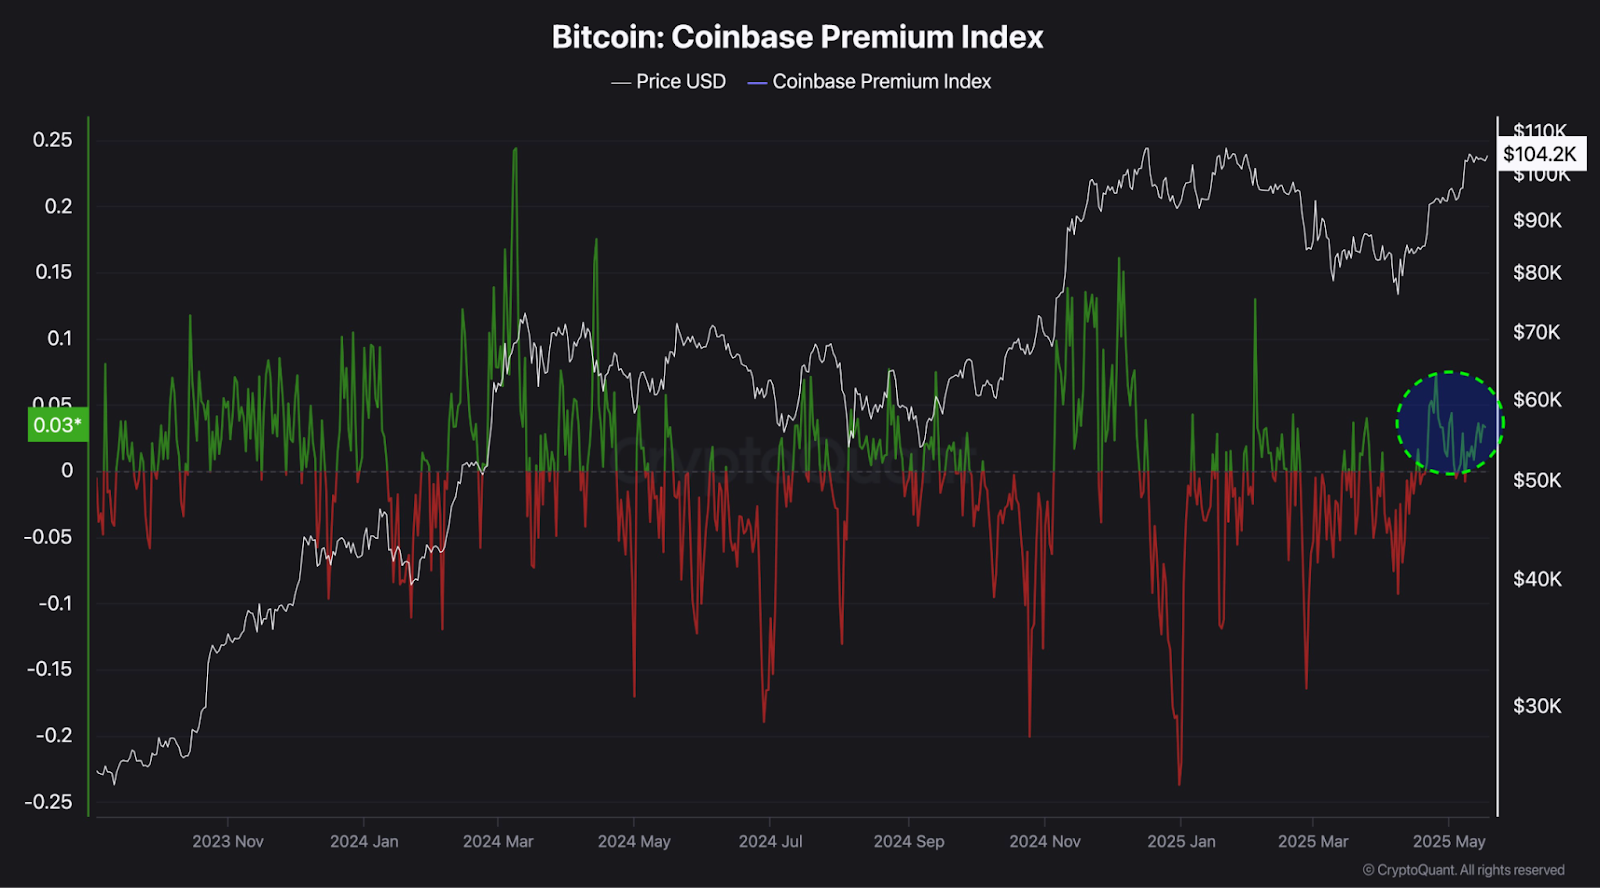
During this period, the index frequently remained below zero. They indicated that institutional players were less interested in the market at that time.
Yet, the recent rise in their values suggests they could be coming back to the market. Over time, this trend has coincided with medium-term rises in Bitcoin’s price, but it continues only if there is lasting interest.
When the token had positive readings in the past, it rose sharply afterward. Market analysts are now questioning if this new increase will act the same as the previous rise above $100K. If this is the case, it might encourage people to buy more in the upcoming weeks or months.
Sentiment Turns Very Bullish Across the Market
Moreover, Alpha Crypto’s Sentiment Gauge charts now indicate that traders and investors are feeling very bullish.
Across April and May 2025, price action is supported by a series of green markers, indicating that the oscillators were bullish to very bullish. They are determined using price trends and other important indicators in the market.
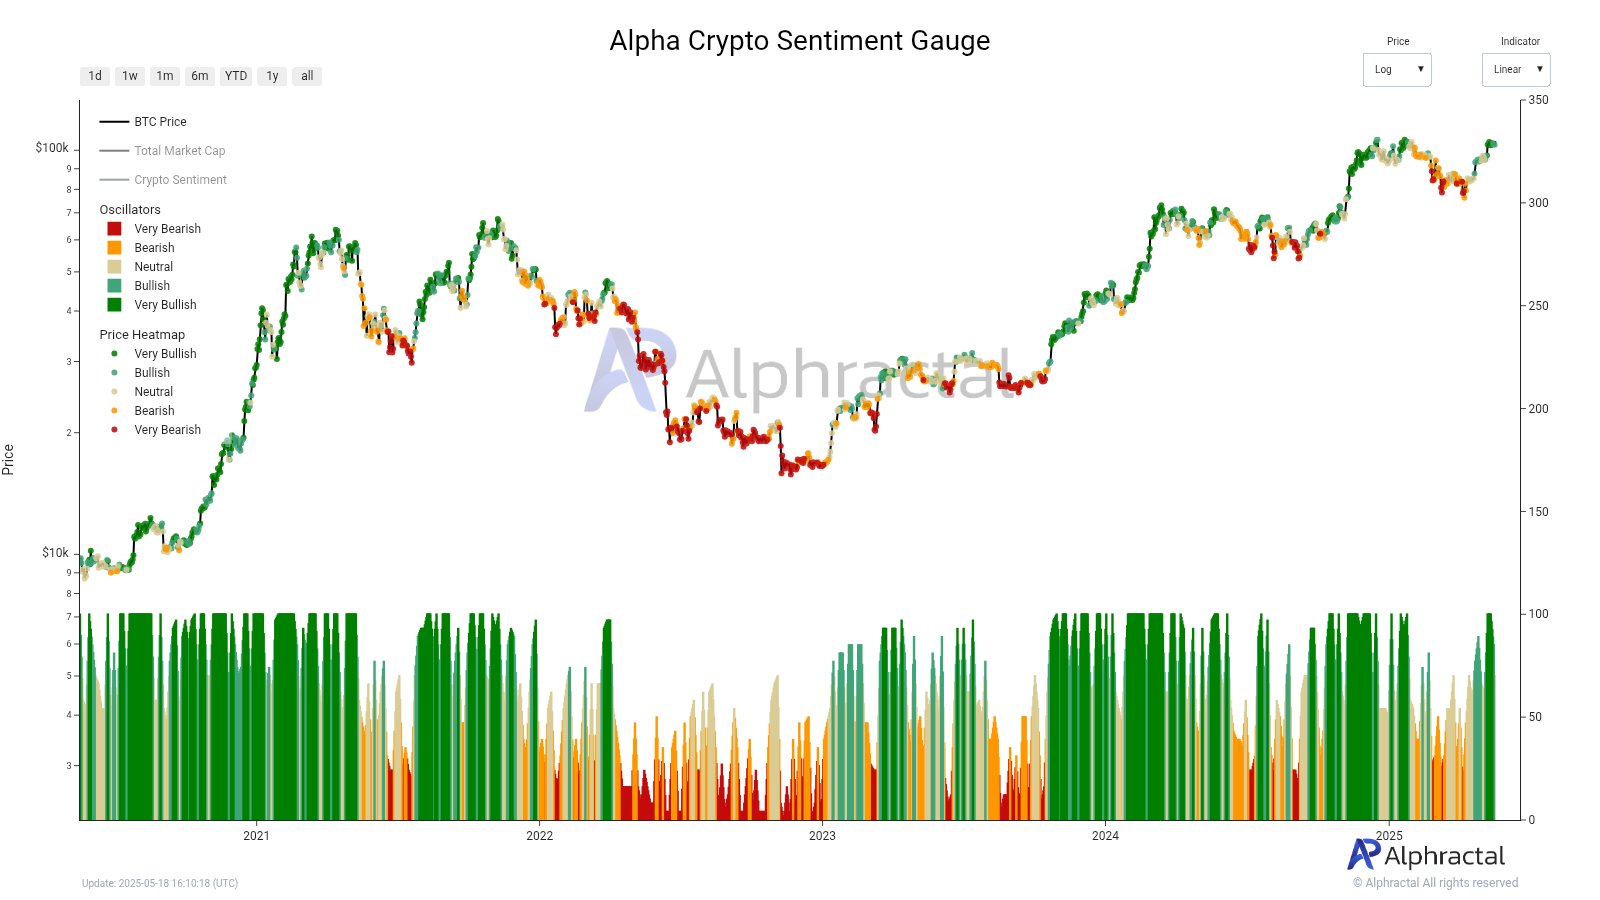
Confidence has been increasing since March 2025 and now matches what is common in bull markets. Still, when everyone is very optimistic, it can also cause problems. While it often brings in new money, it can also cause prices to drop if people become too enthusiastic.
The heatmaps indicate that there are fewer red and orange areas, which used to be more common earlier. This means that there is more agreement among market participants as their confidence grows.
Bitcoin’s Realized Cap Nears All-Time Highs
Meanwhile, the total value of all coins at the last time they were moved is now $906 billion. CryptoQuant’s data for this metric usually represents the confidence of investors more than the recent changes in prices. Bitcoin is currently valued at $104.5K and the realized cap is continuing to rise.
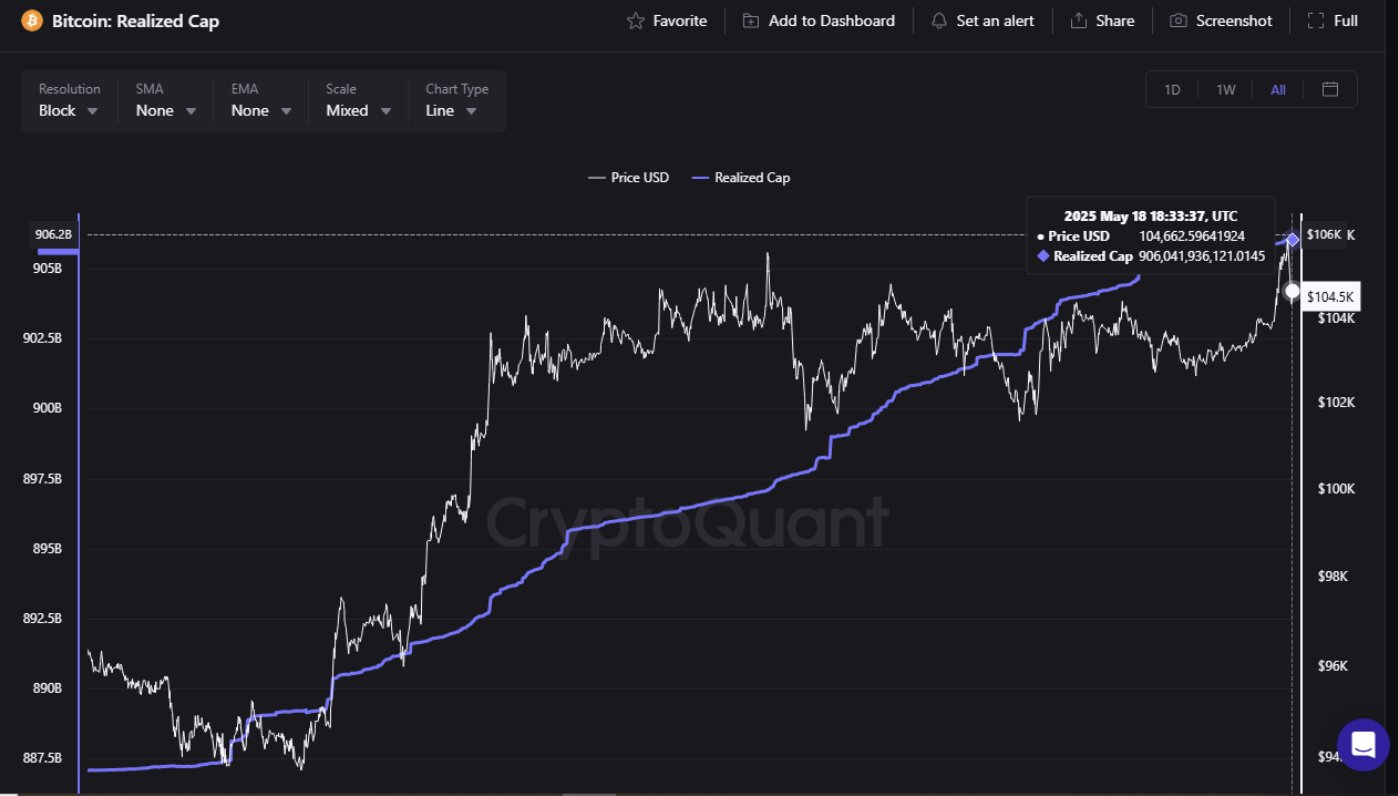
A rise in realized cap usually means that more coins are being bought and sold at higher prices which suggests demand is increasing. In the past, a rising realized cap has usually contributed to new record highs.
According to CryptoQuant, if the Realized Capitalization keeps rising and people keep showing confidence in Bitcoin, it is likely that Bitcoin will reach a new all-time high soon. The current price of ATH is barely above the $106,000 mark, which it reached earlier this year.
Long-Term Fibonacci Levels Show Key Resistance Zones Ahead
On its own technical analysis chart, Bitcoin’s price is still below the 1.618 Fibonacci extension which is currently at $101,343. Often, this level is the first area where prices break out. Still, traders are paying closer attention to the next levels: the 2.618 Fib at $154,522 and the 3.618 Fib at $207,701.
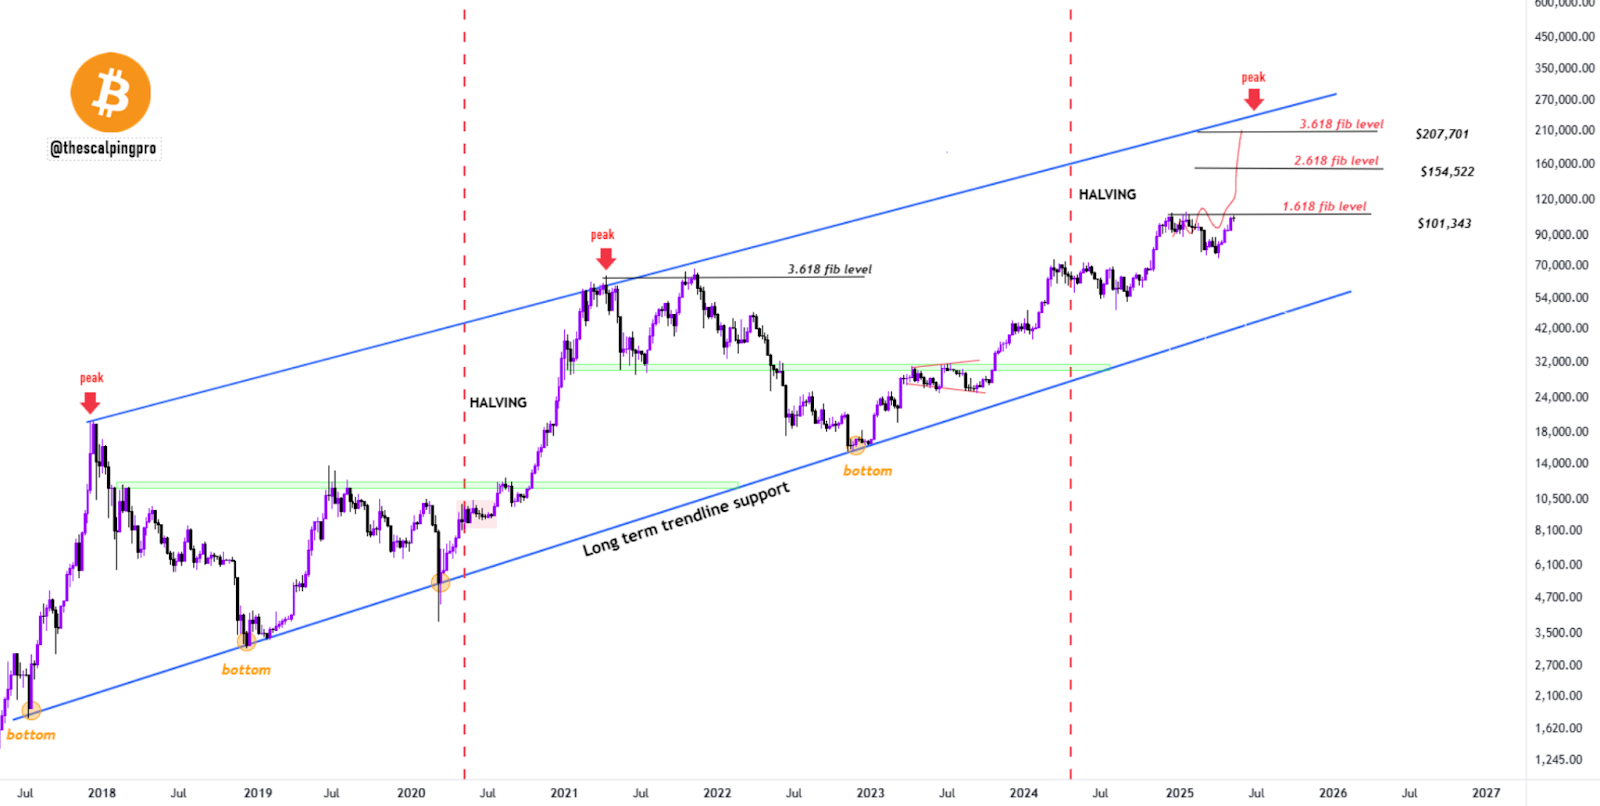
This situation has happened in the past as well. In 2021, Bitcoin reached a high of 3.618 and it is expected to do so again. If Bitcoin surpasses the 2.618 extension, it may reach the upper resistance zone at $207,000.
A long-term ascending channel is visible on the chart and previous highs and lows follow the same pattern. This indicates that the asset is still rising and has not yet come close to its ultimate resistance level.