
- Bitcoin’s realized cap impulse stays elevated, indicating continued capital inflows and structural market strength.
- Coin Days Destroyed rises, signaling early long-term holder movement and possible upcoming selling pressure.
- Demand remains high, but stablecoin inflow momentum weakens, raising questions about future price sustainability.
Long-term on-chain indicators for Bitcoin remain strong, with the realized cap impulse still above key support zones. This is a trend that indicates that there is still capital flowing into the market, and structural demand is still there.
But behind the bullish signals, there are some subtle signs that the current market phase may be getting long in the tooth. If these trends continue, they could pave the way for a broader cycle shift, and analysts are forecasting the potential for a bear market to begin as late as 2025.
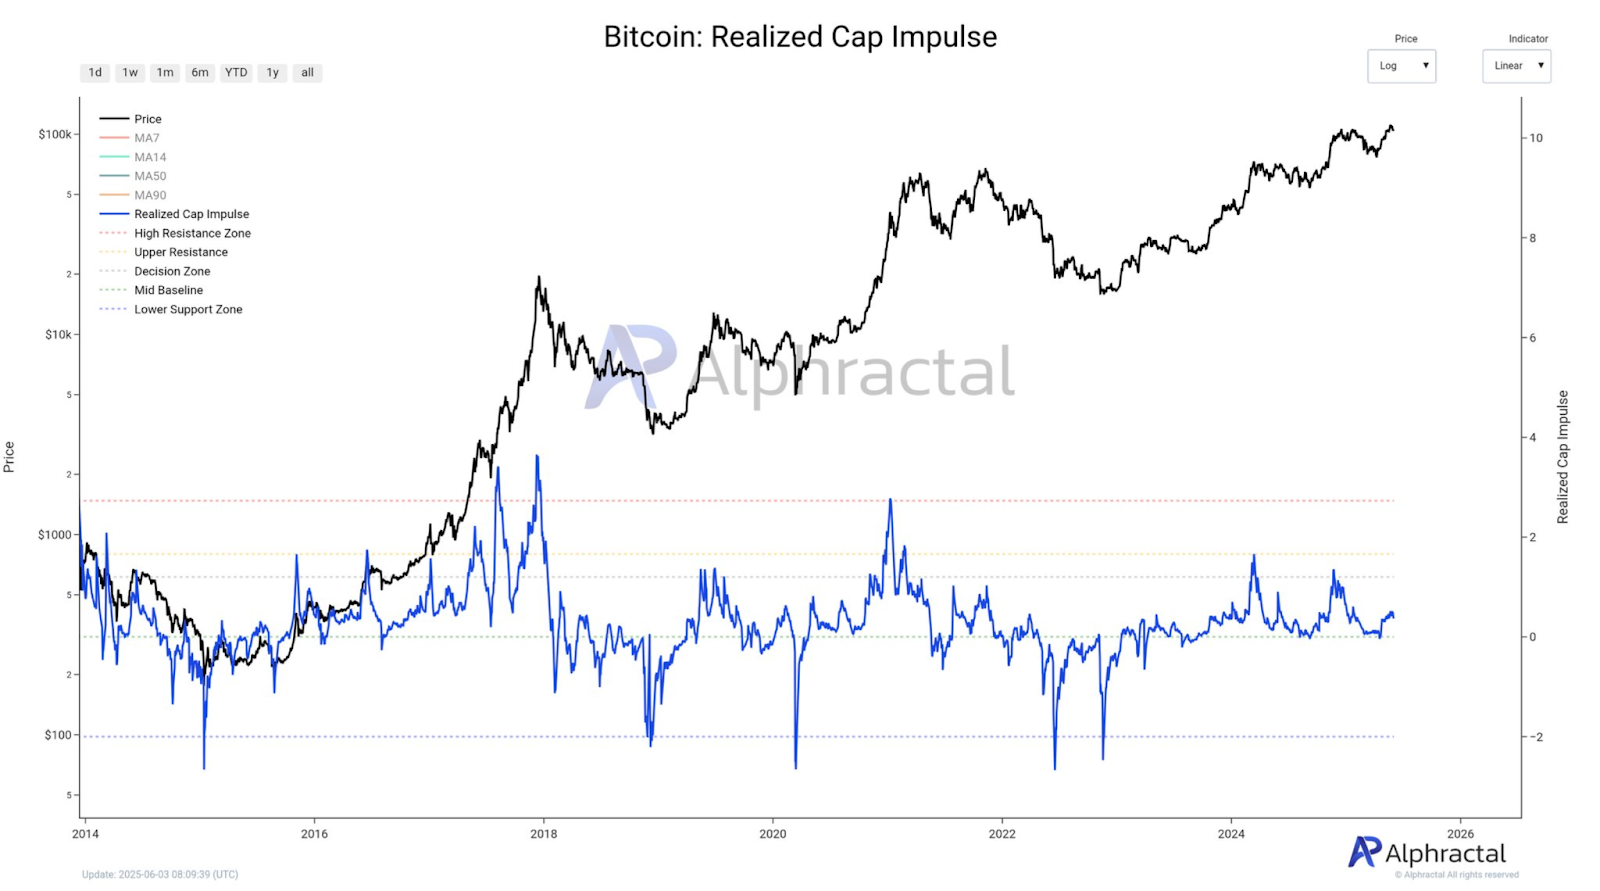
Realized Cap Impulse Signals Market Strength but Approaches Historical Peak Zone
Bitcoin’s realized cap impulse, in both short and long time frames, is still above its decision zone, indicating that capital inflows remain strong.
This indicator measures realized capitalization to show long-term trends in investor behaviour. This metric has thus far marked major cycle bottoms and tops.
The long-term impulse has been steadily rising and is now in an area historically associated with peak market euphoria, which was in 2025.
The impulse curve of past cycles in 2013, 2017, and 2021 were similar before entering extended bearish phases. The pattern indicates the uptrend seen now may be the last leg before a potential reversal.
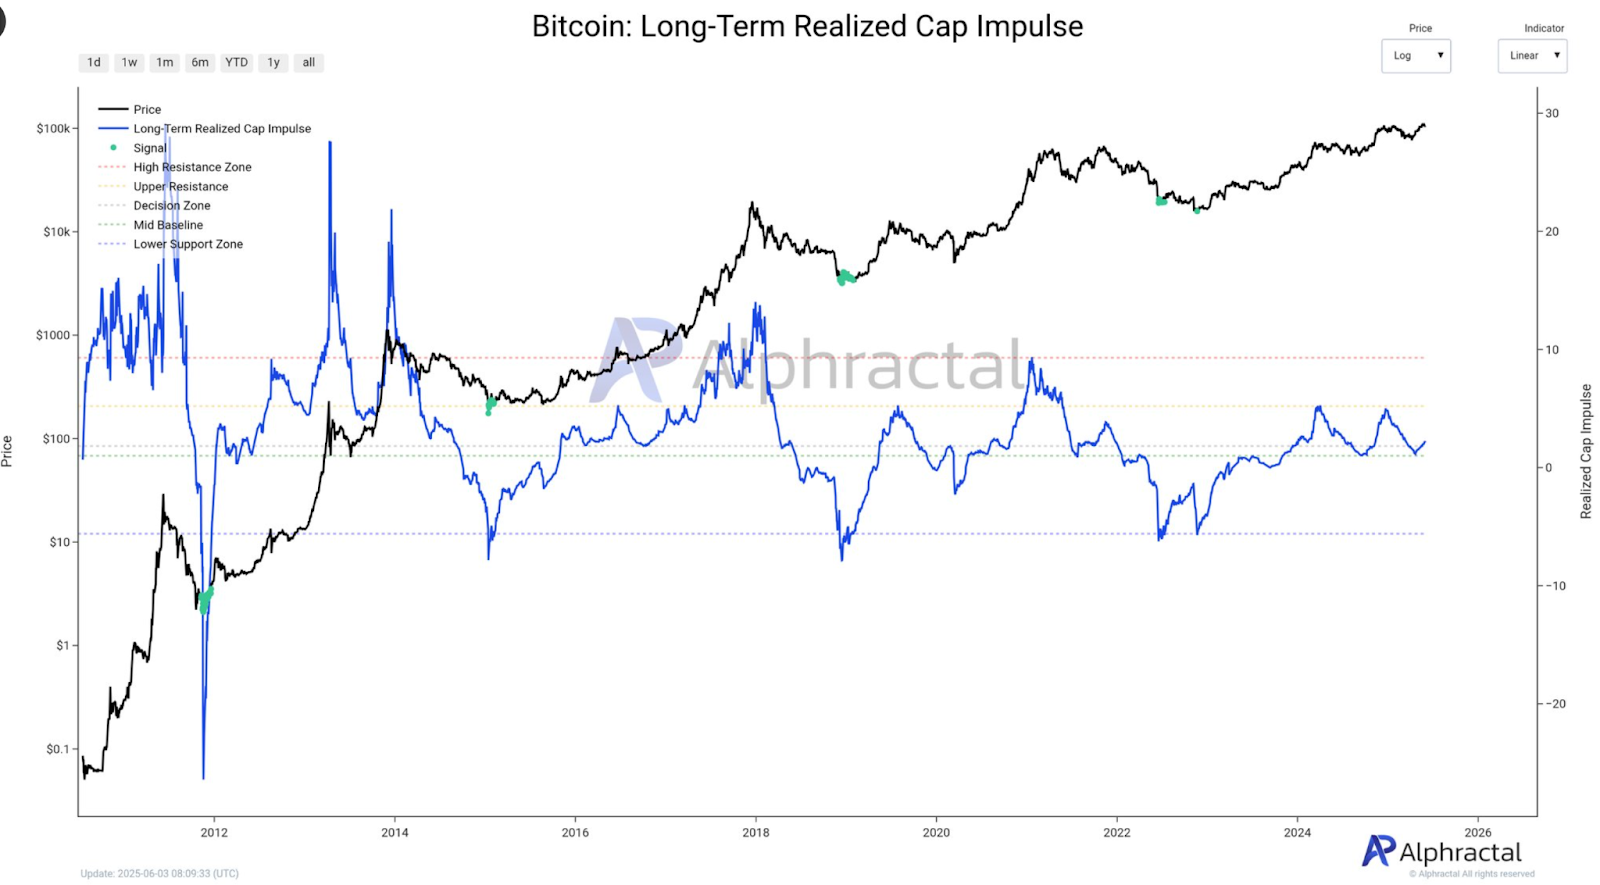
According to projections based on on-chain activity, this bullish impulse can continue until October 2025. Then momentum could wane, leading to a protracted corrective phase through the end of 2026.
Both realized cap behaviour and repeating macro cycle timing support this forecast. It is not yet definitive at the top, but it is close to previous end-of-cycle conditions.
Coin Days Destroyed Shows Early Profit-Taking Signals
Coin Days Destroyed (CDD) has also started trending upwards, which indicates long-term holders are starting to move older coins.
CDD’s 21-day moving average has increased slightly, whereas the 90-day remains stable around 14 million. But the change is notable: these numbers suggest cautious repositioning rather than large-scale exits.
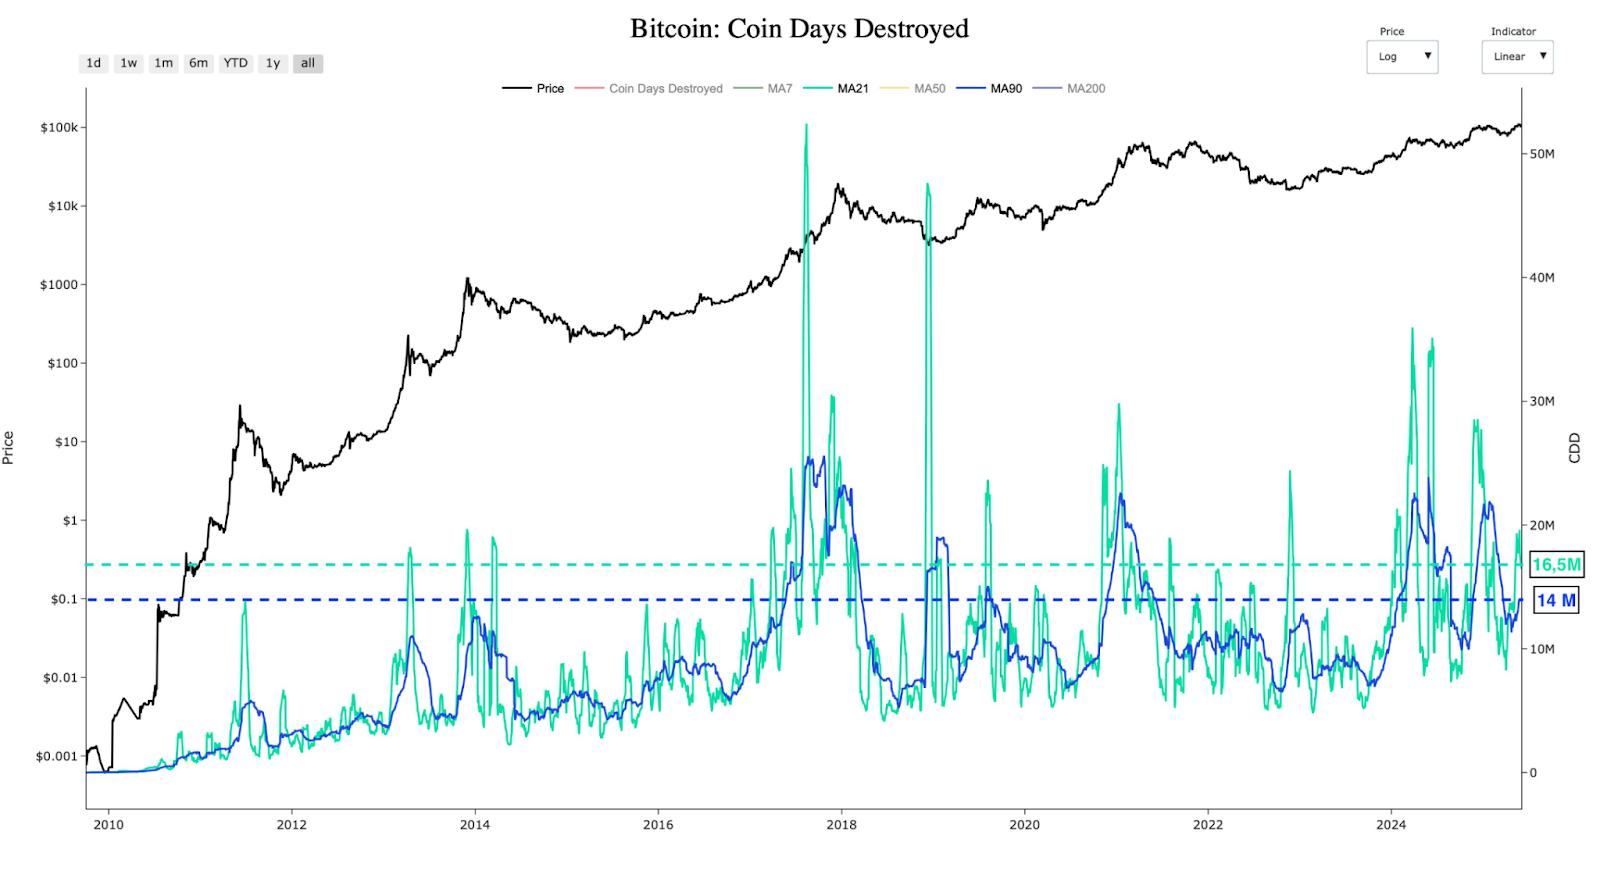
CDD spikes have historically preceded market tops and profit-taking phases. The most prominent examples are periods before the 2017 and 2021 peaks and major miner-driven selling in 2018. CDD is not yet flashing a top, but the increase suggests a change in holder behaviour.
Old coins moving after a long period of inactivity are usually a sign of a move from accumulation to distribution. It doesn’t mean immediate downside, but it is a potential turning point if other weakening metrics are also reinforced.
The trend is subtle, but clear, it is not panic, but preparation. If this movement continues, it could lead to follow-on selling from newer investors and build pressure on support levels.
On-Chain Demand Still Healthy, but Liquidity Support May Be Weakening
Strong inflow data is being seen across several on-chain models, and Bitcoin’s demand metrics remain supportive. Even the difference liquidity model, which compares Bitcoin inflows to stablecoin inflows, still shows positive net demand. Demand remains high, and market structure is stable.
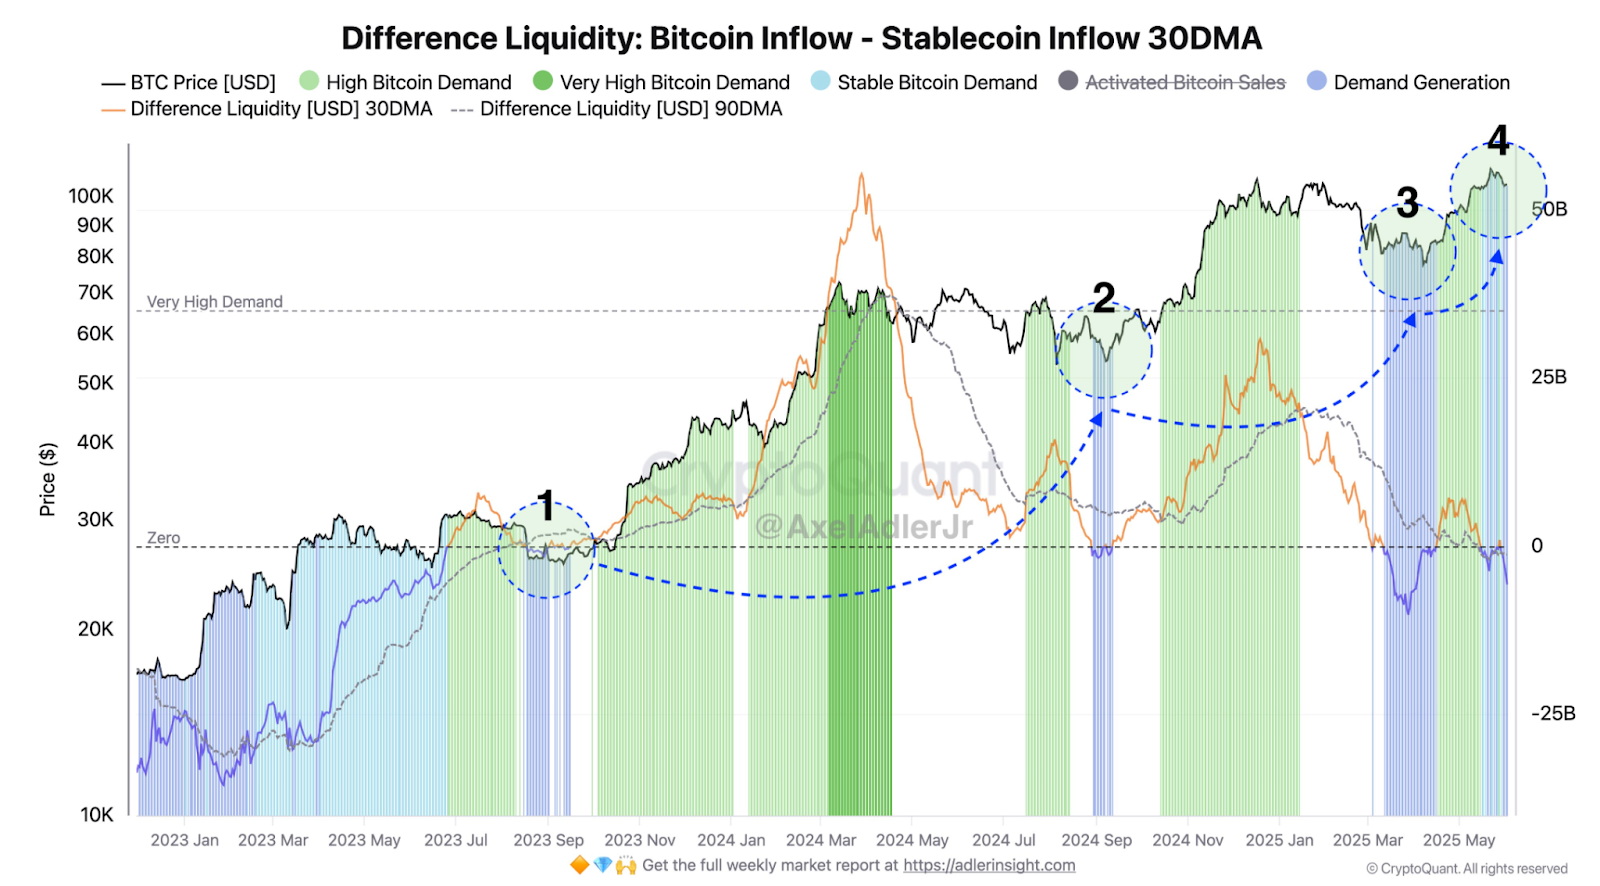
But the 30-day and 90-day moving averages for liquidity difference have flattened in recent weeks. This means that demand is still there, but momentum is not accelerating. This plateau historically has preceded sideways movement or trend reversals.
The support level around $96,700 is the average entry price of short-term holders. If Bitcoin drops below this line, it could start a wave of liquidations and exit behaviour.
Demand hasn’t collapsed, but the slowing pace of inflows may prevent Bitcoin from going much higher. The outlook becomes more and more cautious when combined with increased movement from long-term holders and a mature realized cap impulse.