
Key Insights:
- Spot ETH ETFs post 16 straight days of inflows, led by BlackRock and Fidelity
- Ethereum consolidates near $2,800, breakout could target $4,000 per ZAYKCharts
- On-chain and bridged activity point to rising Ethereum network demand and capital inflows
Institutional and on-chain activity is converging to show renewed strength in Ethereum. On June 9, U.S. spot Ethereum ETFs saw $52.7 million in net inflows, the 16th straight day of positive flows. Ethereum’s price is also consolidating just under the $2,800 resistance and speculation is rising on a possible breakout.
Currently, analysts believe that if Ethereum breaks out of the current range, it will likely reach $4,000. This momentum is facilitated by institutional investors, Layer 2 traction, and improving market sentiment.
ETF Demand Surges as Institutions Accumulate
On June 9, Farside Investors’ data showed $52.7 million in net inflows into spot Ethereum ETFs in the U.S. Fidelity’s FETH added $12.9 million, and BlackRock’s ETHA led the daily gains with $35.2 million. All other issuers remained steady, but grayscale’s mini ETH also saw inflows of $4.6 million.
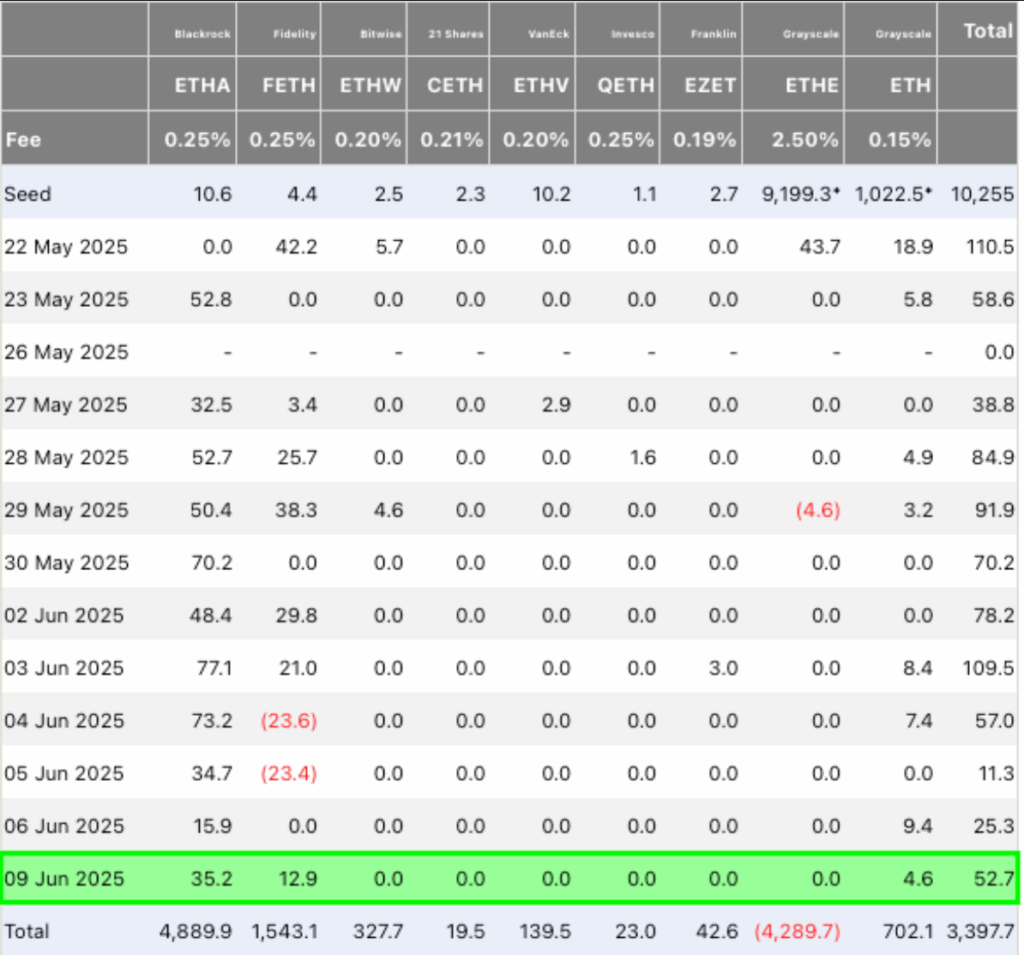
This was the 16th straight day of net positive flows for spot ETH ETFs, indicating continued interest from big funds. Total net flows were broadly positive on June 4 and June 5, despite some minor outflows in some of the funds.
So far, cumulative inflows since the May 22 launch have reached $3.39 billion, with BlackRock and Fidelity leading the list.
As flows continue to rise, top crypto analysts are pointing to growing institutional conviction. Nasdaq-listed Metalpha moved $48.45 million in ETH from Binance to a Gnosis Safe, suggesting direct ETH exposure.
This matches with how ETFs buy, indicating that spot and custodial accumulation is taking place.
Ethereum Price Holds Key Range Amid Technical Strength
Meanwhile, Ethereum has broken out of a large descending wedge and is now trading near $2,690 and consolidating between $2,400 and $2,800.
ZAYKCharts says that this bullish rectangle could be a base for a breakout to $4,000. A move above $2,800 would confirm the continuation pattern and give a 46% upside.
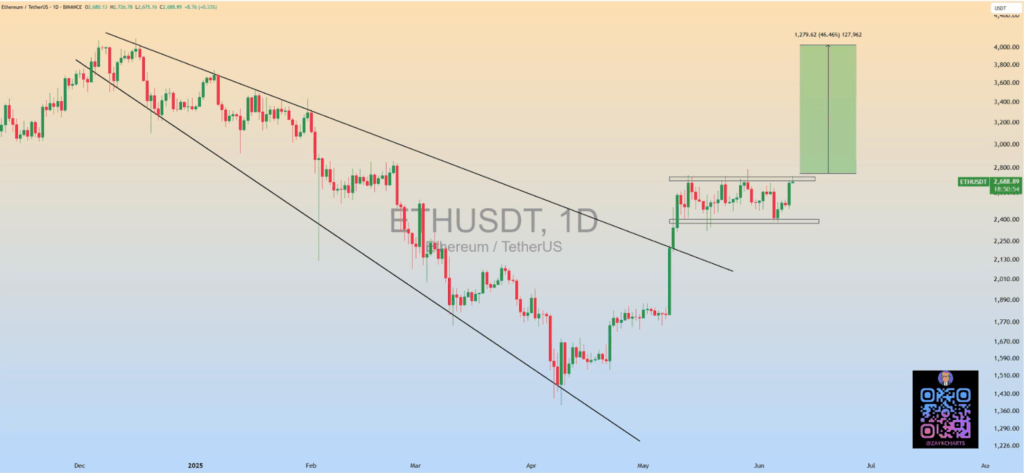
The consolidation comes after a sharp reversal from April’s lows near $2,000, showing that demand has soaked up the recent dip. Ethereum’s price structure is building upward pressure, and ETF inflows add to the story of overall market confidence.
Buyers have so far defended key support levels around $2,400, maintaining the bullish momentum.
Meanwhile, QuintenFrancois said that Ethereum is “about to melt faces” as the asset gains strength in this low-volatility phase. Price action and volume trends point to a buildup before a big move, and the breakout zone is still well-defined.
Network Fundamentals Support Price Action
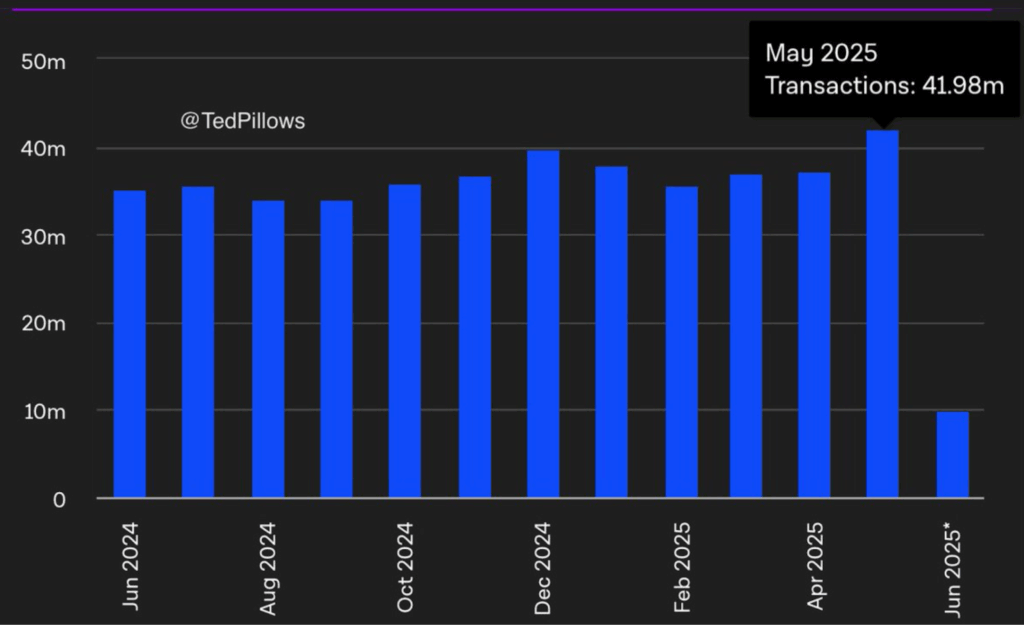
Also, Ethereum’s on-chain data is supporting price action. Data shared by TedPillows shows that the Ethereum network processed 41.98 million transactions in May, the most in a year. June activity is strong, but slightly lower due to early-month seasonality.
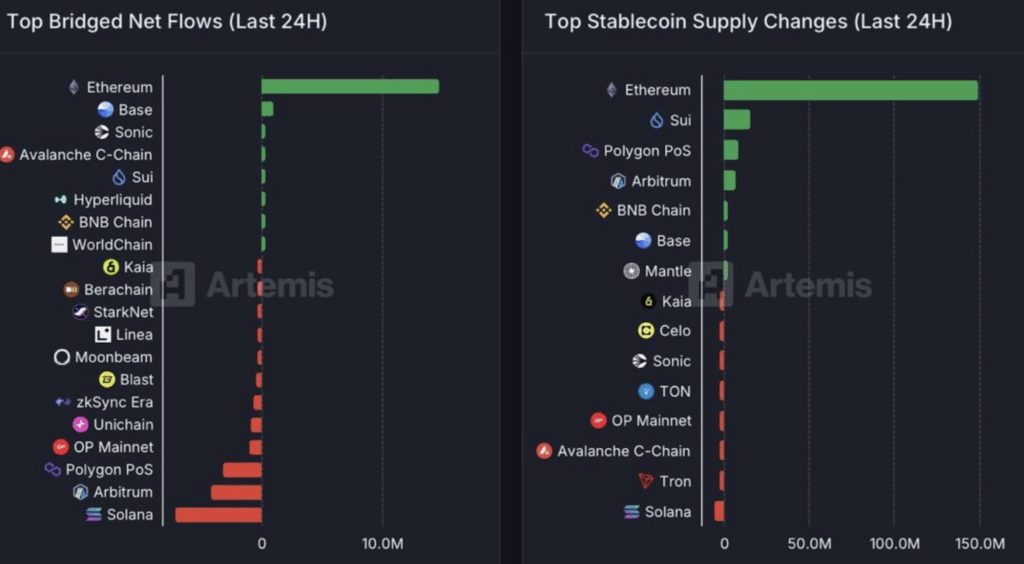
Meanwhile, Ethereum also accounted for the bulk of stablecoin supply growth and net bridge flows over the last 24 hours.
According to Artemis data, ETH had the highest stablecoin inflows and the most capital bridged into the network, surpassing chains like Solana, Arbitrum, and OP Mainnet. This shows an increase in utility and user confidence in the base layer.
Transaction fees have also declined over the past 30 days in Ethereum Layer 2 ecosystems and this has helped to sustain user activity.
Base, World Chain, and Arbitrum all saw 30-85% fee drops while Base was the only L2 to see fee growth. Scalability and long-term adoption is supported by lower costs, especially during high transaction periods.