
Key Insights:
- HBAR shows bullish momentum as ETF buzz and rising long positions support the notioin of a bullish Hedera price prediction.
- Hedera’s price consolidation at $0.179 signals a potential breakout above $0.182, targeting $0.190 resistance.
- With a MACD bullish crossover and RSI in the 60s, HBAR is positioned for upward momentum, aiming for higher resistance levels.
The cryptocurrency market has recently experienced a surge in attention, and Hedera Hashgraph (HBAR) is among the assets gaining momentum.
With growing interest from investors and potential approval of crypto exchange-traded funds (ETFs), many are keen on a Hedera Price Prediction to $1 mark.
The current market environment suggests a bullish outlook for Hedera, but factors such as ETF developments and market sentiment will play a crucial role in determining its future trajectory.
Hedera Price Performance Amid ETF Developments
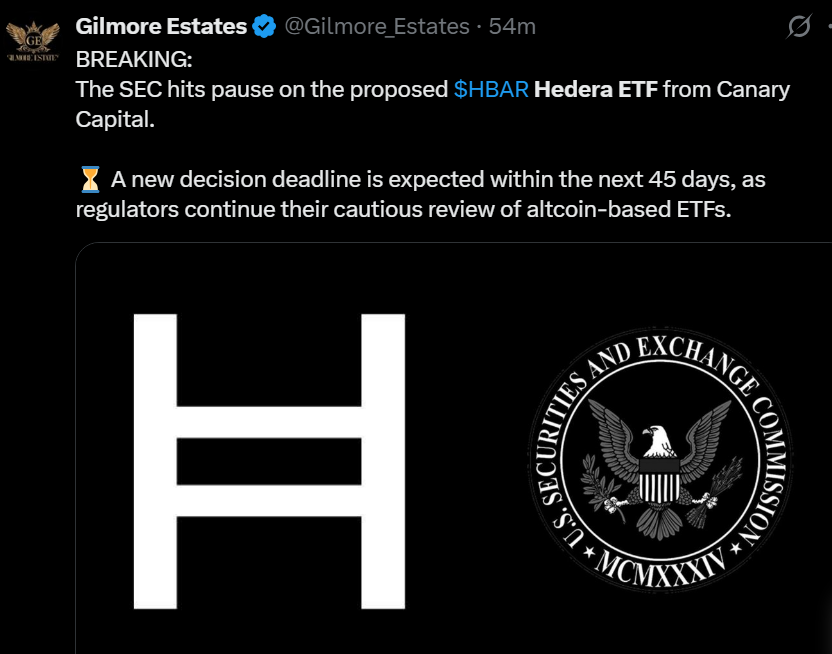
Hedera Hashgraph (HBAR) has gained attention amid growing ETF speculation, especially with recent SEC delays on ETF approvals for Polkadot and Hedera.
Despite regulatory uncertainty, HBAR has shown resilience, with recent price upticks suggesting a shift towards a bullish market structure.
The focus on ETF filings has boosted HBAR’s price, as ETF approvals are seen as a sign of legitimacy, potentially attracting institutional interest.
Traders remain optimistic, believing positive ETF outcomes could further support HBAR’s price. Historically, positive ETF news has led to price rallies for cryptocurrencies, and Hedera could follow this trend if approvals come through.
As HBAR consolidates at current levels, the anticipation of ETF developments is helping maintain upward momentum. Hedera’s price action has flipped from a bear market to a more bullish structure, signaling the potential for a breakout in the near term.
Hedera Price Prediction: HBAR Flips Bear Market Structure
Hedera’s (HBAR) price action has shown notable volatility, with the current price at $0.1797, reflecting a 1.51% gain over the past 24 hours.
The price peaked at $0.182 before retracing to find support at $0.1773, indicating a consolidation phase after a sharp upward movement.
Volume analysis reveals a 5.35% increase in 24-hour trading volume, reaching $132.89 million, sug
Moreover, the volume market cap ratio of 1.75% indicates strong liquidity, supporting potential bullish momentum.
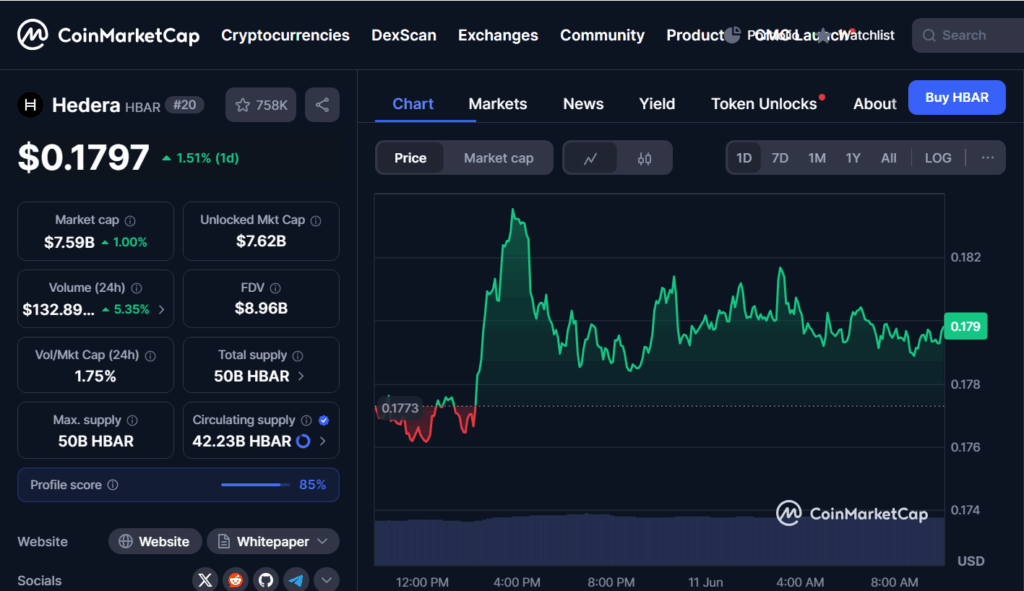
As HBAR stabilizes at $0.179, the market awaits a possible breakout. A move above $0.182 could push the price toward resistance levels at $0.185 – $0.190.
However, failure to hold support at $0.1773 could lead to a dip toward the $0.175 level, signaling potential bearish pressure if market sentiment shifts.
CoinGlass On-Chain Data Backs Up Bullish Bias
CoinGlass on-chain data strongly supports a bullish outlook for Hedera (HBAR), as long positions continue to rise.
This indicates growing trader confidence in HBAR’s potential for upward movement, particularly as the price has consolidated above key support levels.
Increased long positions, along with the decline in short positions, further suggest a shift toward a positive market sentiment.
The correlation between rising long positions and the price movement is significant, especially after late May, when HBAR saw a sharp upward spike toward $0.25.
This price action aligns with traders expecting further gains, although some caution is warranted after the price retraced.
As long positions remain dominant, a breakout above resistance levels near $0.20 could trigger more upward momentum.
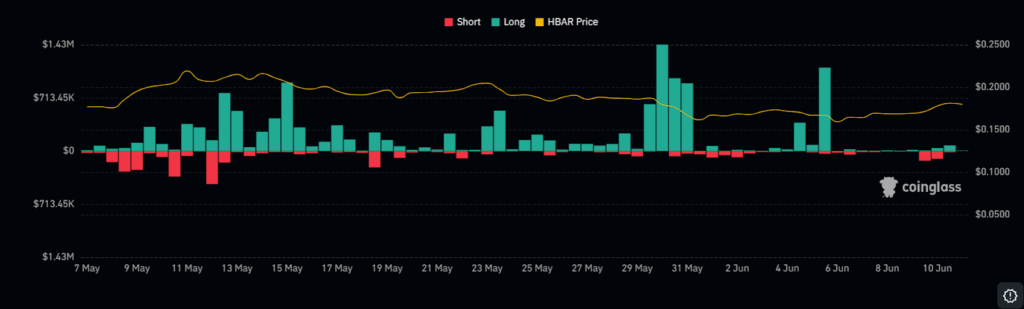
While the market has recently been consolidating, long positions outnumber short positions, reinforcing a bullish bias. If this trend continues, HBAR may push past resistance and aim for higher price targets.
Technical Indicators Align for Bullish Breakout
According to TradingView, multiple major technical indicators are suggesting that Hedera (HBAR) could be on the verge of a bullish break.
The Moving Average Convergence Divergence (MACD) indicator suggested a bullish trend as the MACD line was above the signal line.
This is a bullish crossover, and indicates that the buying power was greater than the selling power.
In addition, the Relative Strength Index (RSI) is in the middle 60s, indicating that HBAR is in the bull but not an overbought region.
It indicates that the price has not reached the overbought zone yet, which could provoke a correction. In case the RSI could muster the psychological 70 level, then HBAR could have further scope to trade at higher levels.
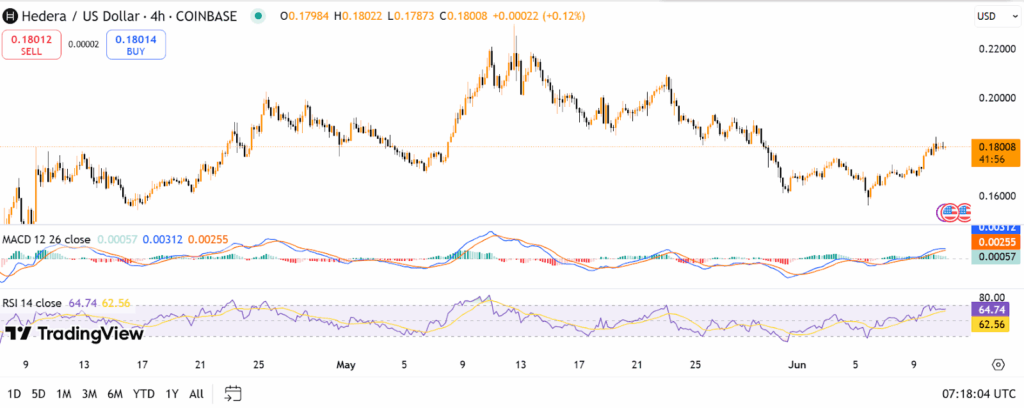
With HBAR sustaining trade in a narrow range between $0.175 and $0.182, a close above this range may result in a major price action.
With the technical configuration presently in place and the prevailing developments surrounding ETF, there is a possibility that HBAR may attain greater resistance levels in the coming days.