
Key Insights:
- Supply/Demand indicator showed that the SUI chart was experiencing high volatility at the price of $3 as per several CHoCH patterns, as well as a new BOS.
- The chart indicated that there was a significant decrease in the daily stablecoin transfer volume between SUI and Solana.
- Significant long liquidations can be spotted at the SUI/USDT liquidation map at levels below $3, and it reached its highest at around the $2.96-$2.98 price level.
Supply/Demand indicator showed that the SUI crypto 4H chart was experiencing high volatility at the price of $3 as there were several Change of Character (CHoCH) patterns.
Additionally, there’s a new Break of Structure (BOS), which denotes trader activity.
SUI Crypto Price Action Analysis
Such CHoCH patterns at major pivot areas were signs that the sentiment back and forth between buyers and sellers reversed regularly, which most often set the stage of solid action in one direction and another.
The most recent BOS at the region of the $2.90 indicated that the recent selling pressure was cleared and this could be the precursor of a short term bullish reversal.
Yet a series of abortive efforts to overcome resistance pegs at around 3.50 and 4.00 continued to prevail, enabling these zones to solidify as overhead supply.
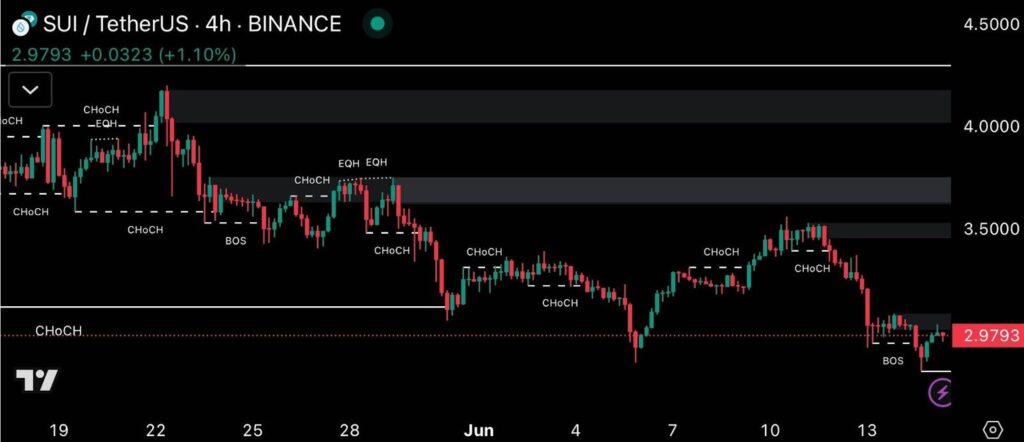
Equal highs (EQH) noticed in the past highlighted that liquidity was resting at a high level and could be attacked in case bulls make a revival.
The internal market structure adjustments suggested repeated changes and not consistent patterns.
As the volatility continues to rise and prices respond intensely to demand and supply zones, SUI could be on the verge of a definitive move. In such a scenario, traders are likely to follow through above $3 or another visit to recent lows at about $2.85.
SUI Crypto Comparison to Solana
The chart indicates a significant decrease in the daily stablecoin transfer volume between SUI and Solana up till June 12 2025.
SUI enjoyed a major percentage in stablecoin transfers, $11.8B, compared to Solana at $5.5B, which indicated a major advantage of SUI.
The flip makes SUI the more actively traded blockchain of stablecoin activity for a month-to-date (MTD) time period.
For the June 1-June 10 time period, Solana assumed control to be volume leading, and June 5 had the highest volume.
Beginning June 11, though, the stablecoin flow into SUI accelerated like crazy, and it’s a sign of possible injections of on-chain liquidity, new nodes, or protocol-driven activity.
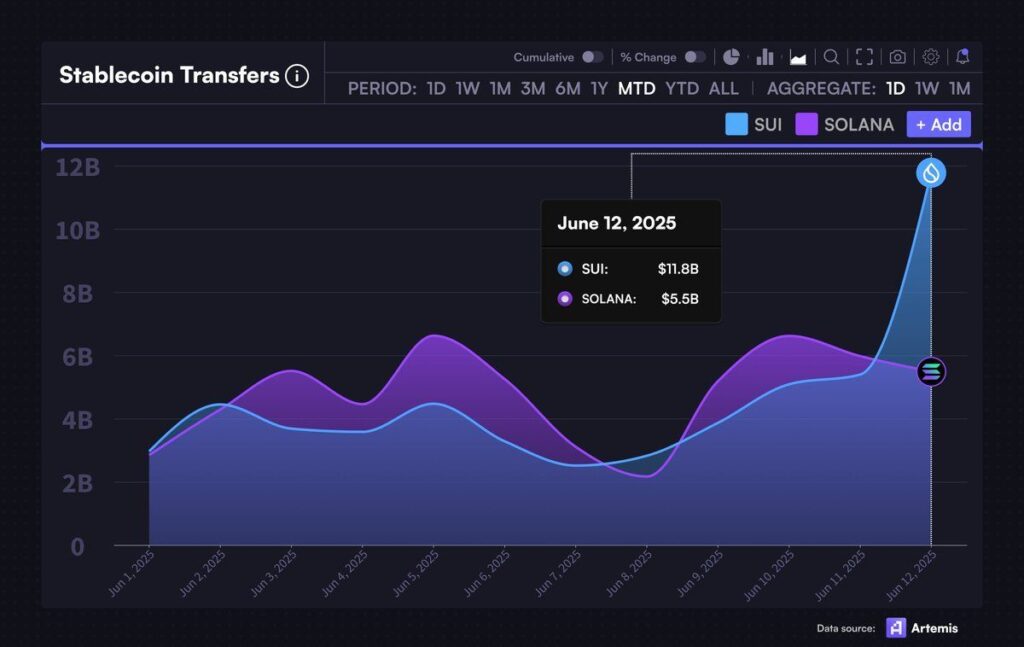
This boom may be explained by the growth in DeFi activity or changes in the utility towards stablecoins in favor of SUI.
The graph of SUI is steeply sloped, whereas the graph of Solana is more flat in comparison, so there is a possibility of the momentum remaining in favor of SUI in a short period of time.
Although this over 24-hour control does not validate an extended tendency, it shows an increasing use and transaction volume in the SUI network, mainly in the operation of stablecoins.
Future monitoring will identify whether SUI continues to take this lead.
SUI Liquidation Map
A considerable mass of long liquidations can be spotted on the SUI/USDT liquidation map at levels below $3. It reached its highest at around the $2.96-$2.98 price level.
This shows, at lower, heavy long exposure now closed. The present one is equal to $303, which also coincides with a pivot area level of pressure changes regarding leverage.
Short liquidations have commenced, piling on the right above $3.07, crossing $3.15, which implies increasing danger to short positions if the price surges.
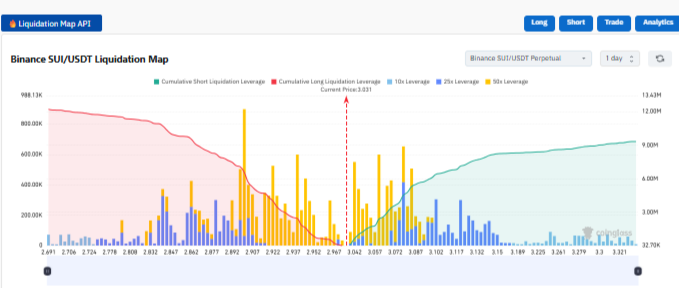
The bars also indicated aggressive leverage 25x within the zone of $2.98-$3.05. This showed high-risk trades in the recent past.
If the price of Bitcoin surpassed $3.07, a short squeeze would take place. Going below $2.98 could open the downside pressure again.
All in all, the map displays a neutral balance area in the vicinity of 3.02-3.04, and the following step using either liquidation group could determine the temporary direction.