
Key Insights:
- SEI crypto forms a falling wedge, signalling a potential breakout from current lows.
- DeFi TVL surpasses $500M, showing resilience despite price decline.
- Price action mirrors altcoins awaiting Bitcoin’s push to all-time highs.
So far, SEI crypto, the native token of the Sei blockchain, has returned to its historical support levels of almost $0.18-0.20 after several months of slow price decay.
On a weekly level, SEI is trading within a similar demand area it had made in Q4 of 2023, when the price began getting serious about rallying to the ceiling.
This cyclical tendency of lower highs and returning demand within this range can presently be illustrated by the sheer number of technical indicators specifying the scheme.
Multi-Top Distribution and Falling Volume Indicate Reaccumulation Phase for Sei Crypto
The SEI/USDT weekly chart (Binance) shows a pattern of weakening rally as the price tends to form three consecutive (parabolic, followed by two sequential) tops above 0.80, 0.60 and 0.40, respectively.
These lesser peaks indicate that sellers have been appearing at deteriorating rates of enthusiasm, pushing the price toward the lowest point of 0.18-0.20.
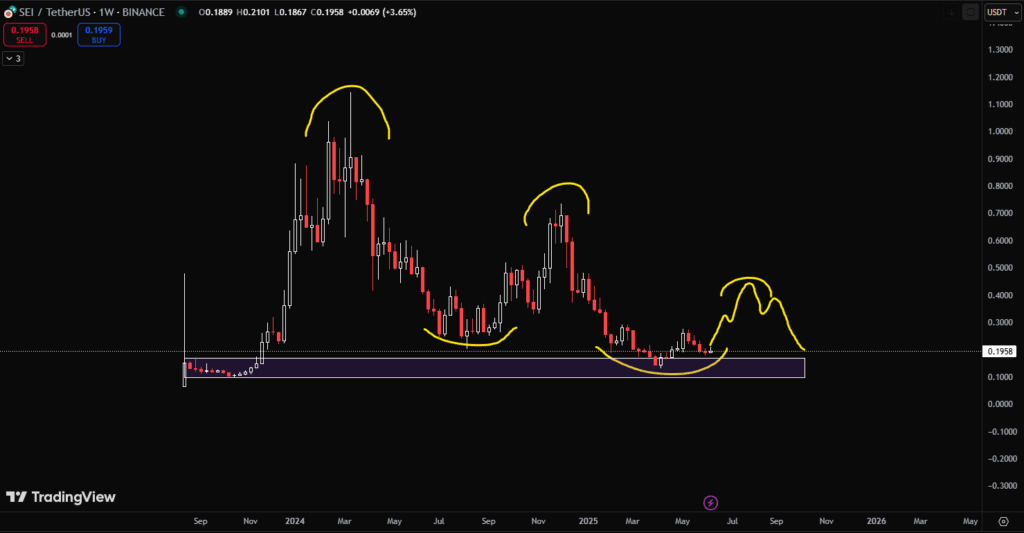
This is visually strengthened with the descending arc pattern and the schematic illustrated in the weekly chart, which refers to the cyclical correction period.
The recent price behaviour implies that another lower high might be developing as a minor relief rally before a continuation or reversal, contingent, of course, on the macro factors, mainly the movement of Bitcoin.
SEI has been trading in a traditional falling wedge shape on the daily chart, and this should be interpreted as a forthcoming breakout.
Price has already touched the upper limit of the wedge various times, and the ongoing breakout move has taken SEI 1.76 percent higher on a daily basis to $0.1796.
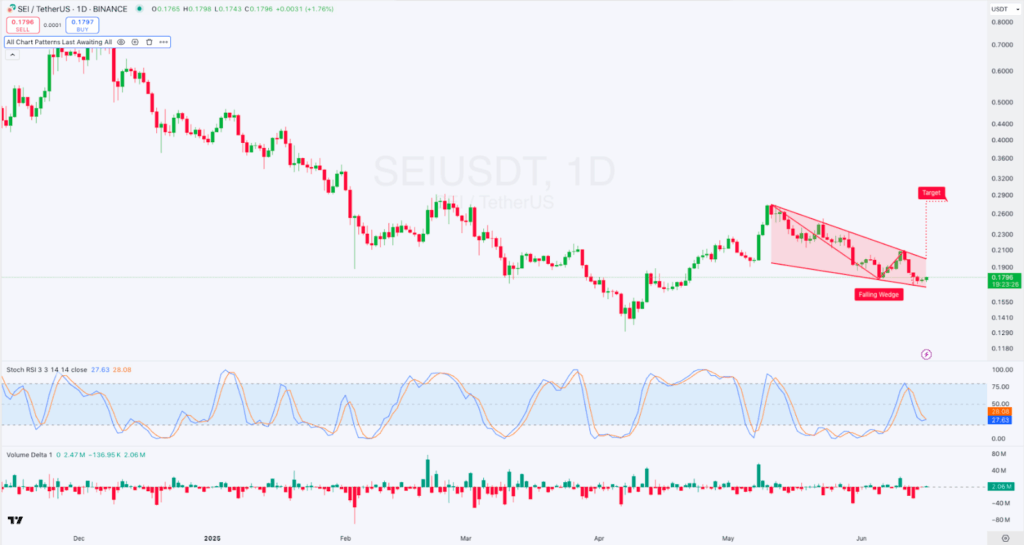
The calculated increase in this wedding envelope is a possible move that will take SEI to the $0.28-0.30 area, a significant move with the March 2025 reverse. Nonetheless, the initial ceiling is expected to be at the resistance of $0.223-0.24.
A slight positive divergence can be seen on volume delta as the green bars are up, and SEI gets a bid below the wedge support.
The stochastic RSI of SEI now stands at 27.63 and 28.08, meaning that it is in the oversold region. This is likely to spur an immediate rebound provided the overlaid market has momentum.
Sei Crypto DeFi Fundamentals Remain Strong as TVL Nears Half a Billion
Although the price has been falling steadily, the fundamentals of the Sei ecosystem are not affected to a large degree.
DeFiLlama data shows that the Total Value Locked (TVL) of Sei in DeFi has already exceeded half a billion dollars, with the growth observed in the last 24 hours amounting to 0.40%.
This value does not stop, as it has steadily increased, especially since the beginning of 2025. This indicates further interaction with the ecosystem and user activity.
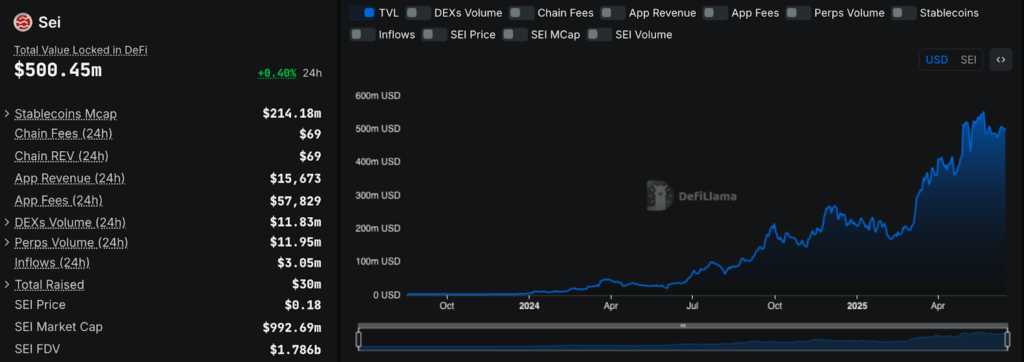
These volumes reflect healthy Spot and derivative market usage. Activity at the app level is not very high but consistent; the daily app revenues are $15,673, and the app fees are $57,829.
The periodical tendency observed on the chart of SEI resembles a more general mechanism of altcoins known as cyclic pullbacks to the areas of fundamental support. After which, they resume growth in rhythm with the bullish runs of Bitcoin. Most altcoins would print a low-high rally in case Bitcoin records new all-time highs. The same behaviour has recurred in the previous cycles.
In the case of SEI, shifting the present range, which is $0.18-0.20, to the range of $0.36-0.40 would represent a 2x gain, which has been the case as far as Bitcoin rallies more broadly. The caveat here is that those moves frequently do not manage to overcome past cycle tops, establishing macro lower highs within altcoin markets until we see new stimuli.