
Key Insights:
- TRUMP crypto executed a precise breakout trade with a stop-loss below prior support and profit target near $9.15.
- TRUMP crypto 5-minute chart showed a range between $8.90 and $9.10 before breakout hit $9.2117.
- TRUMP crypto price reclaimed resistance zone, suggesting 9.10 may now act as immediate short-term support.
TRUMP crypto is the latest coin gaining popularity as analysts examine its breakout pattern, intraday swings, and momentum signals. Technical observations pointed to a possible base push arising amid confirmation signals on the following decisive TRUMP price swing.
Breakout Execution Confirmed on TRUMP Crypto
Analyst TraderRai noted that TRUMP crypto depicted a perfect breakaway structure. The chart also indicated an ascending trendline that showed a pattern of higher lows before the breakout. TRUMP crypto price gained solid structural backing, presented by the trendline, which pushed the price higher towards the breakout zone.
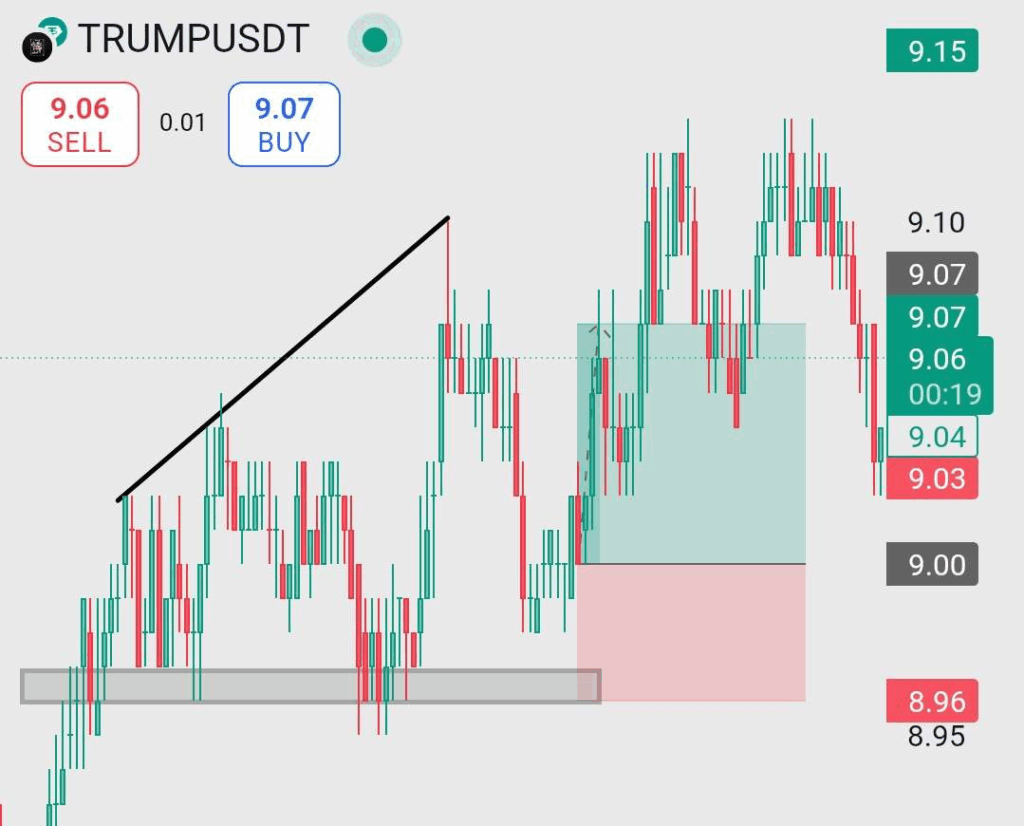
Besides, TRUMP crypto closed above the recent swing high with solidity, affirming a confirmed breakout that had manifested. This validated the arrangement and marked a stronger upward impulse. Therefore, breakout zone turned into a new support level after a successful retest.
In addition, a green shaded box on the chart marked the profitable trade level. The analyst suggested that the trade strategy placed the stop-loss at the bottom of the grey support zone, protecting risk. Further, the breakout drove TRUMP crypto to a near top of $9.15, before retracing.
Additionally, on the right side of the chart, profit-taking was observed with the help of red candles after the target was reached. Meanwhile, the sequence emphasized orderly performance as the breakout-retest-continuation formation held as expected.
Intraday Breakout Pushes TRUMP Crypto Higher
Analyst Andrεω tracked TRUMP crypto action in the 5-minute chart. The initial trading was marked by a visible downward drift from the $9.4000 level. Consecutive red candles formed a lower low, driving TRUMP price below $8.9000.
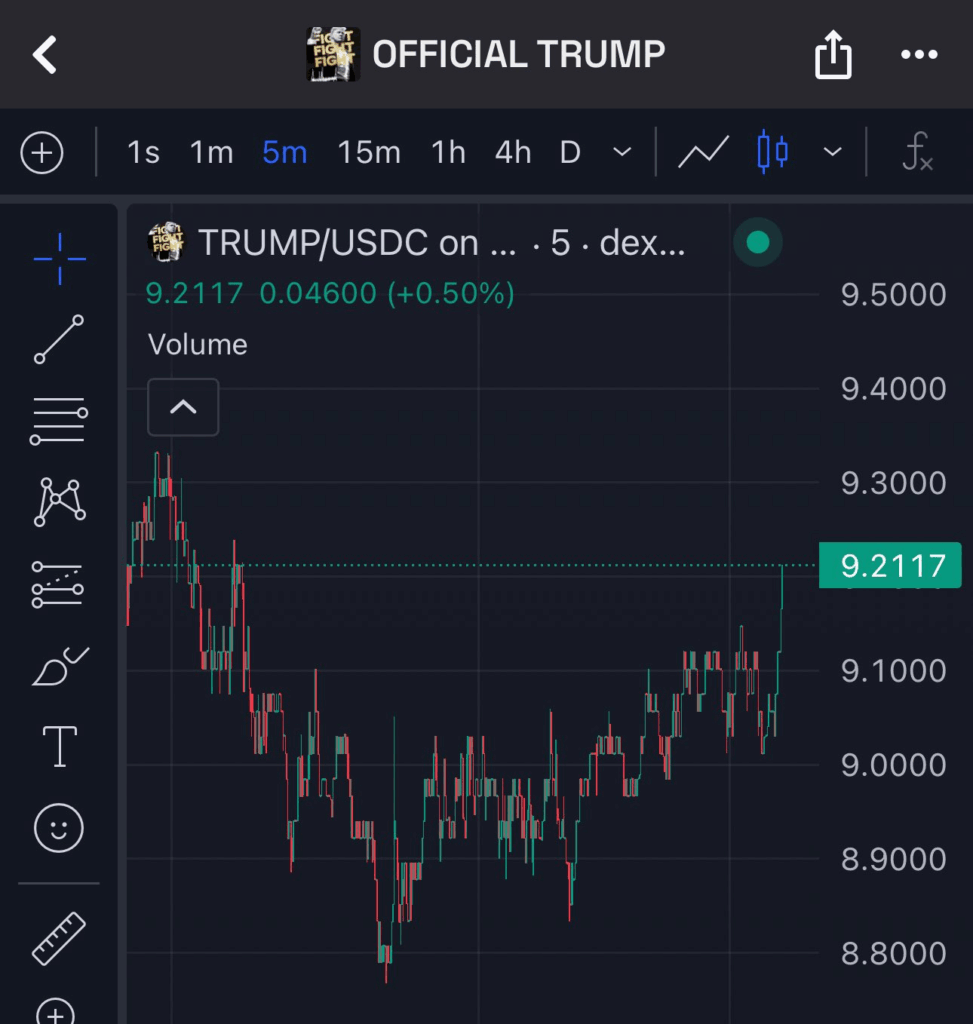
However, after the decline, the analyst noted that TRUMP crypto moved into sideways consolidation. More so, TRUMP price held within a narrow range between $8.9000 and $9.1000 for several sessions. Small-bodied candles with long wicks signaled tests of both resistance and support within the band.
Further, progressive formation of higher lows suggested the rise of bullish pressure. Also, a clean breakout took TRUMP crypto over resistance at $9.1000. TRUMP price was pushed to $9.2117 by strong green candles at the time of analysis.
Consequently, the breakout suggested buyers regained short-term control, reclaiming lost ground. The analyst indicated that the breakout level near $9.1000 will serve as immediate support if any pullback develops.
TRUMP Crypto Holds Key Range Near $9
Additionally, according to another analyst, TRUMP crypto stabilized near $9.07. TRUMP price moved within a tight range between $8.80 and $9.20. This followed a sharp decline from the $12.00 region observed earlier in June.
The analyst described this phase as a possible base-building structure. Further to that, the extended sideways pattern pointed to reduced bearish momentum for TRUMP coin. TRUMP crypto remained at a technical pivot as it sought a clearer trend direction.
Moreover, the Relative Strength Index (RSI) was pointed out at 50.95, having crossed a bit lower than its signal line at 52.32. This indicated that bullish momentum was weak. The indicator remained close to the neutral level with an indication of indecisiveness.
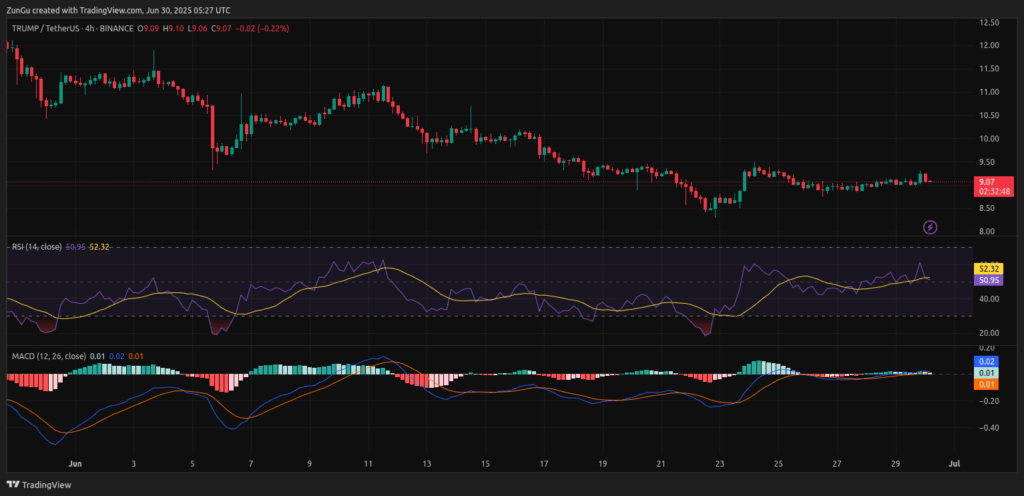
Subsequently, the RSI shot above 60 in a short-lived bounce, implying that there was buying pressure, which soon faded. However, the RSI managed to form higher lows than flat price action, indicating a subtle divergence.
On the other hand, TRUMP crypto revealed additional momentum clues through the Moving Average Convergence Divergence (MACD). The MACD line remained at 0.02, slightly above its signal line at 0.01.
In addition, the histogram stayed in positive territory but with shallow bars. This implied that bullish momentum is weak. The MACD and signal lines remained mostly flat, further supporting a neutral outlook for TRUMP crypto forecast.
Furthermore, a stronger bullish confirmation would require a clear MACD crossover supported by expanding histogram bars and rising volume. Any bearish crossover could negate the weak upward bias observed.