
Key Insights:
- SUI crypto analyst indicated a completed Wave 1 impulse and a deep Wave 2 retracement.
- SUI crypto displayed a large cup and handle pattern, holding near the neckline support.
- RSI divergence on SUI crypto weekly timeframe suggested possible bullish momentum if the trendline breaks.
SUI crypto analysts defined price levels and structural dynamics that cut across its short-term outlook. SUI price moves were framed by clear Elliott Waves, a developing cup and handle, and tight intraday reversals, all providing clues for a precise SUI crypto prediction.
Indicators Structure Support SUI Crypto Bullish Case
According to analyst CryptoBullet, SUI crypto formed a textbook Elliott Wave sequence on its daily chart. The analyst confirmed that Wave (1) completed as a five-wave impulse, while Wave (2) retraced deeply to retest prior consolidation near $2.50.
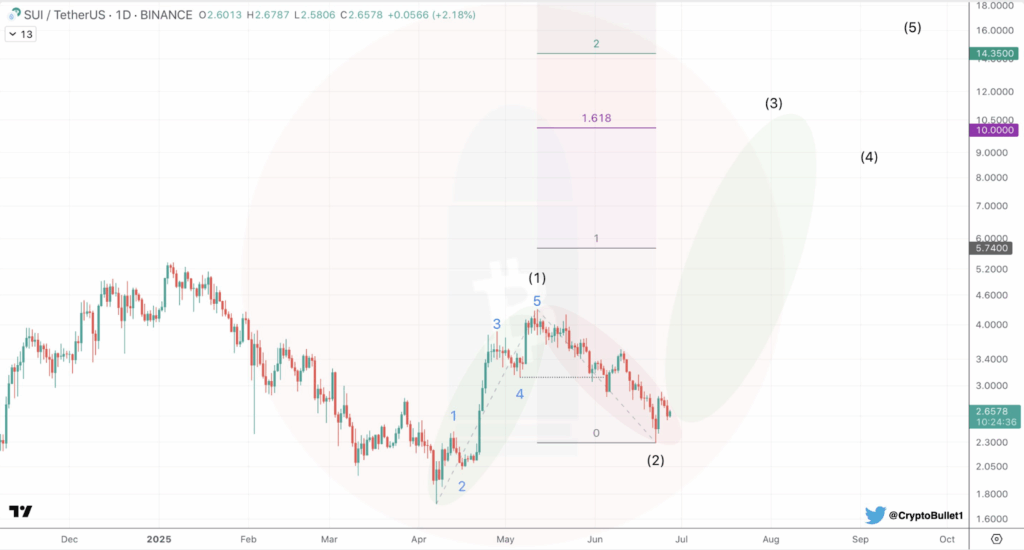
More so, the correction respected classic Fibonacci retracement behavior for Wave 2, which typically erased most of the prior impulse before resumption. The analyst introduced Fibonacci target extensions at 1.0, 1.618, and 2.0, which indicated that there was strong potential toward the upside of Wave (3).
In the meantime, SUI crypto price projection that targets the 1.618 extension was close to $10.50, whereas the 2.0 extension included the estimation of the level at $14.35, which could be reached, in case the trend is maintained.
Additionally, SUI crypto traded near $2.65 while SUI price attempted to confirm the $2.50 pivot zone as a valid support area. If confirmed, the next impulsive move could develop as projected, pushing the altcoin toward a new all-time high. The pattern suggested a stronger upside as the wave sequence aligned with standard Elliott Wave principles.
SUI Crypto Holds Neckline Support
Furthermore, analyst Rekt Capital indicated that SUI crypto made two unsuccessful attempts at the resistance level. The blue line indicated an initial rejection near $4.78, while the second push was rejected at $3.78, as indicated by a red horizontal line.
In addition, SUI crypto consolidated near $2.67, hovering above the neckline zone. According to the analyst, if this horizontal support fails, the larger bullish structure may be invalidated. A decisive close below $1.92 could expose further downside.
However, holding this area could maintain the base for the next breakout attempt above the falling trendline.
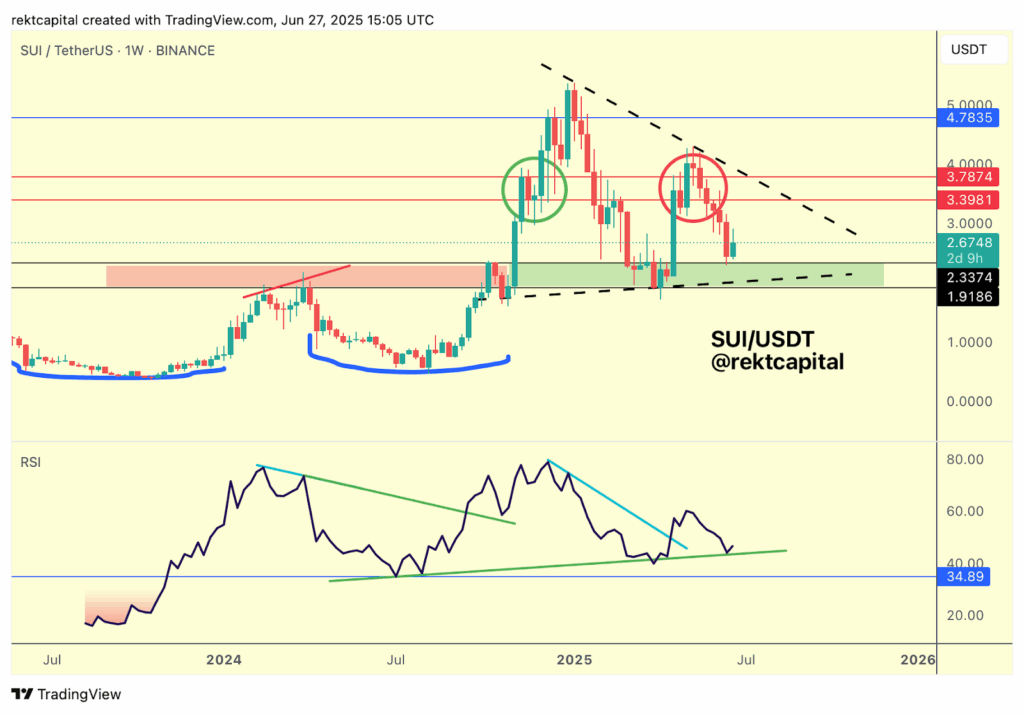
Further, the analyst noted that RSI displayed a declining trend in price. The RSI made a defined trend resistance as seen by the pattern on the lower highs in the main chart.
Additionally, a secondary upward-sloping RSI support trendline suggested a potential bullish divergence. The indicator remained above 34.89, a level that had contained recent downside momentum. If this support holds, there could be a shift in market sentiment.
Also, the analyst outlined that a break above the RSI downtrend line would support any move to reclaim higher ground. For SUI crypto investors, the RSI configuration acted as a supporting signal for any sustained price reversal. A confirmed RSI breakout may align with the asset’s move beyond the descending trendline.
Precise Bounce Trade Executed on Intraday Drop
Moreover, analyst Trader Rai highlighted a clean impulse-consolidation-bounce setup. This showed a sharp selloff from just under $2.80 to approximately $2.60, enclosed within an orange ellipse.
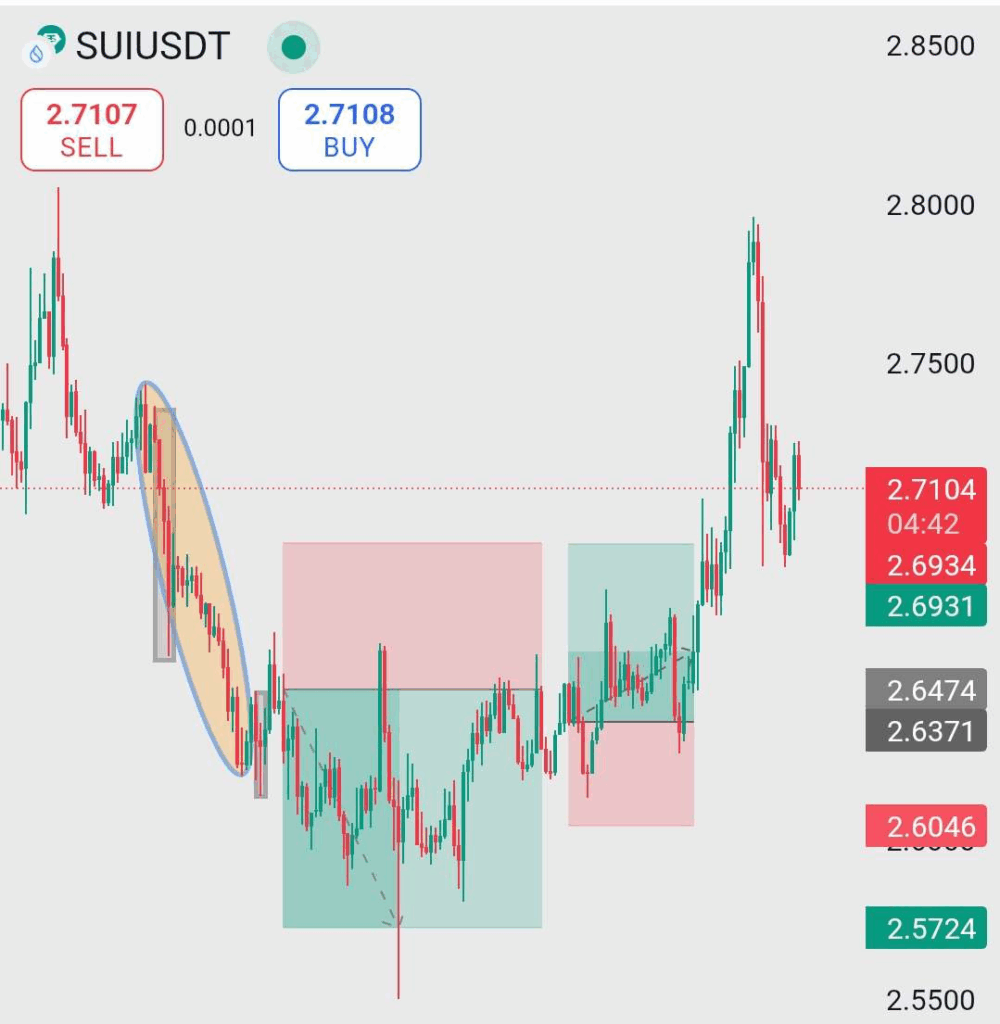
Besides, after this steep drop, a rectangular green zone indicated where SUI crypto price found support and consolidated. Buyers absorbed supply within a narrow band near $2.57–$2.65. Repeated long wicks indicate failed pushes lower as buyers gradually stepped in.
According to the analyst, the bounce trade was executed when SUI crypto broke upward from this zone. The asset quickly surged to the target profit near $2.75, aligning with short-term resistance. SUI price then retraced slightly, showing profit-taking activity. This sequence added clarity to near-term SUI crypto price prediction for traders.