
- Average ETH ETF investors are currently facing unrealized losses of around 21%, according to Glassnode.
- ETH’s price has dropped from ~$3,536 at its U.S. ETF launch in July 2024 to around $2,600.
- The reintroduction of U.S. trade tariffs mostly contributed to Ethereum’s price decline, with ETH hitting a yearly low of $1,472.
Ethereum investors who jumped into the market through the spot ETFs from BlackRock and Fidelity are now facing massive losses. Ethereum is currently struggling to stay above $2,600, and according to Glassnode data, the average ETF investor is currently nursing unrealized losses of around 21%.
Despite recent gains on ETH and a small rally from last week, bearish technical indicators show a disturbing future for Ethereum’s price action. Here’s what to keep in mind.
Ethereum ETFs Leave Investors “Substantially Underwater”
When the spot Ether ETFs launched in the U.S. in July 2024, there was much fanfare.
Big names like BlackRock and Fidelity were in on the action and on launch day, ETH was trading around $3,536. At the time of writing, however, it was hovering near $2,501. This means that investors who bought in early are facing heavy losses.
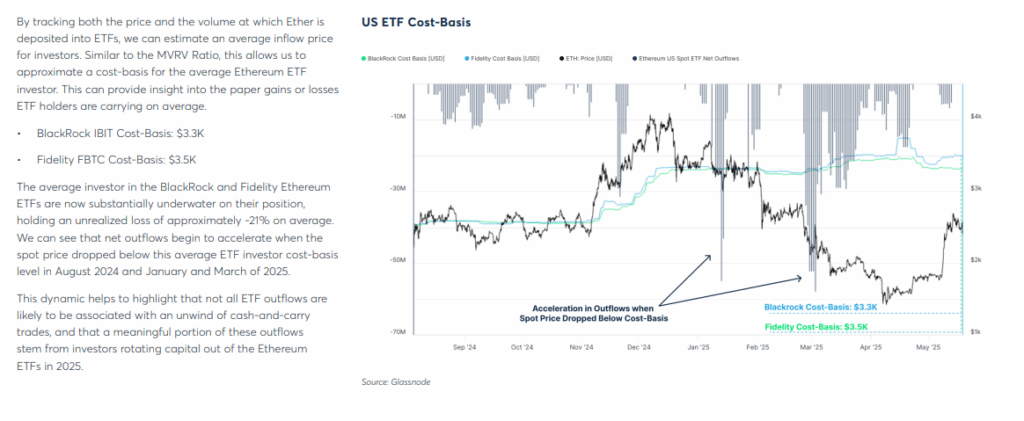
According to a May 29 report by Glassnode, the average cost basis for BlackRock’s Ethereum ETF is around $3,300, while Fidelity’s average entry point is even higher at $3,500.
With ETH currently down over 25% from those levels, most ETF investors are “substantially underwater.”
Glassnode notes that outflows from these funds started to become serious whenever Ethereum’s spot price dipped below those average entry points. This was especially noticeable in August 2024, as well as in January and March of this year.
Trade War Fears and Political Pressure
One major event that contributed to Ethereum’s downturn was the reintroduction of trade tariffs. On February 2nd, ETH was trading above $3,000. However, just days later, US President Donald Trump signed an executive order that imposed heavy tariffs on imports from China, Canada, and Mexico.
The market reaction was severe, and risk assets (including cryptocurrencies) fell heavily as investors pulled capital out in a panic. On April 9th, the day Trump’s tariffs officially went into effect, Ethereum had crashed to its 2025 low of $1,472.
While the rest of the crypto market has somewhat recovered from that low, ETH’s price has not rebounded enough to bring these ETF investors any comfort.
Recent Inflows And Possible Stabilization
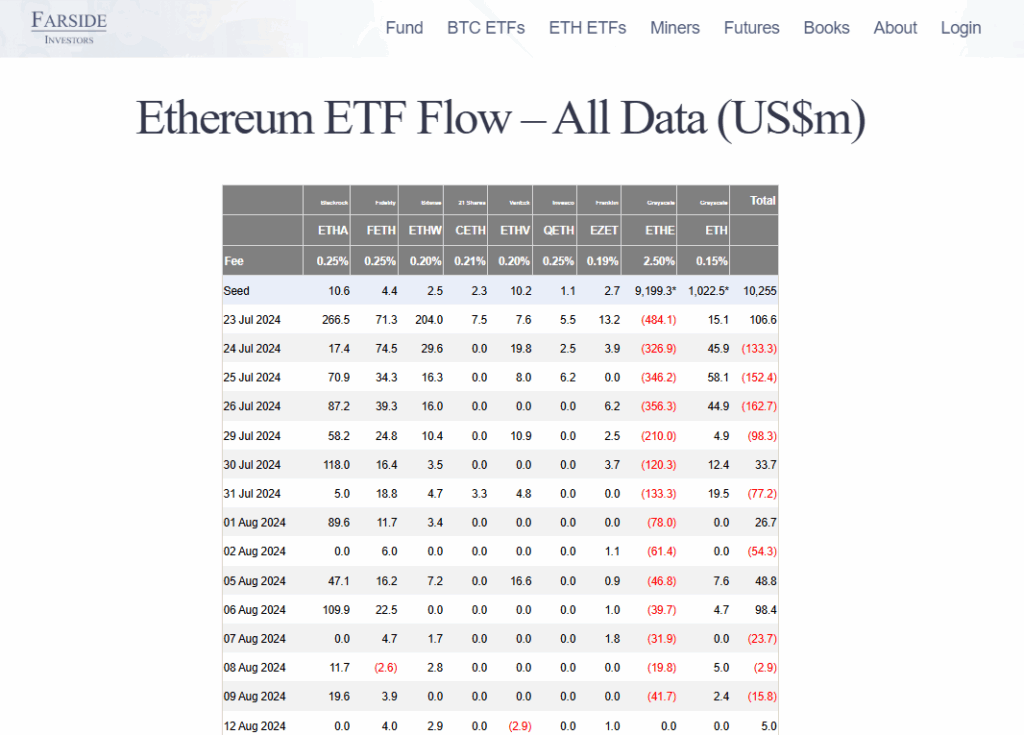
Despite the gloomy picture, there are signs of incoming interest in Ethereum ETFs. For example, since May 16, these assets have seen nine consecutive days of inflows worth $435.6 million.
Analysts believe this change is due to sentiment from the easing of trade war concerns. On May 28th, a U.S. federal court blocked major parts of the tariff policy, in a development that massively boosted investor confidence.
Still, the effects of the Ethereum ETFs on the rest of the market are limited. According to Glassnode, these ETFs accounted for just ±1.5% of Ethereum’s total spot trading volume at launch.
Even during peak growth in November of last year (amid Trump’s re-election), the volume share rose only slightly above 2.5% before declining again.
ETH Faces Major Downside Risk
From a technical standpoint, Ethereum’s current price action appears bearish. In the last 24 hours, ETH around 1%, after sliding back toward the $2,500 mark. This decline came after the cryptocurrency failed to hold itself above $2,780.
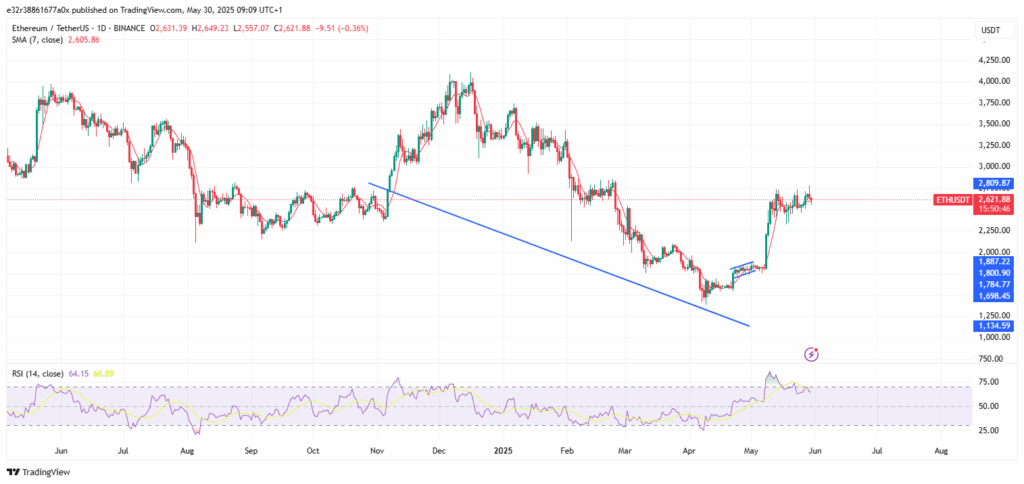
Ethereum has also broken below its 7-day Simple Moving Average, which shows short-term control by bearish traders. The Relative Strength Index (RSI) has dipped below the neutral 50 level on the hourly timeframe, while the MACD indicator is firmly in bearish territory.
In essence, both of these show that momentum is tilting downward. Investors should note that Ethereum’s current price action is largely ranging between two important price levels.
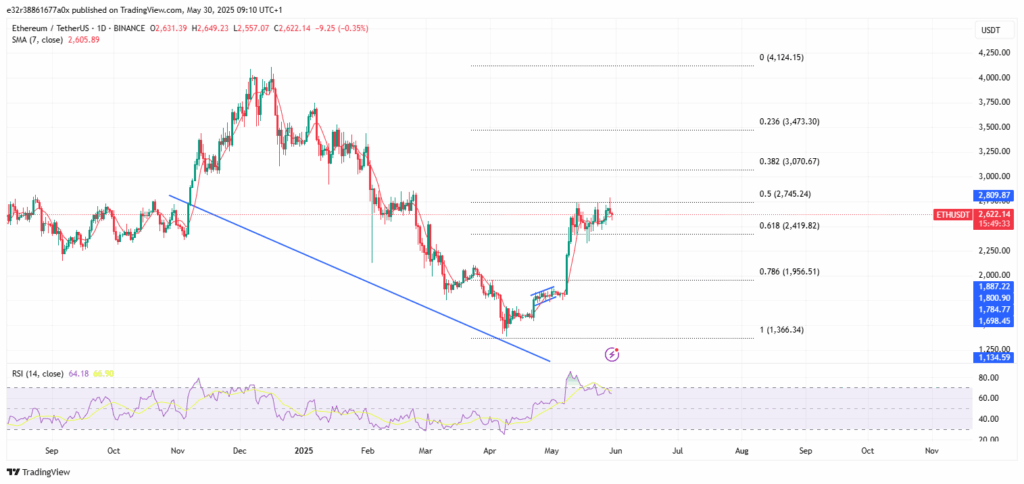
Immediate resistance lies at $2,625, followed by stronger hurdles at $2,650 and $2,720. If ETH can break above $2,720, it could aim for higher targets at $2,880 or even $2,950.
On the downside, if support around $2,600 fails, ETH could retest the $2,500 and $2,440 zones.