
Key insights:
- Open interest jumps 17.4% in 24 hours, raising caution signals.
- $91K resistance aligns with trader’s realized price level.
- Inverse head & shoulders hints at short-term breakout potential.
Market data indicates that the latest rally in Bitcoin may not have the strength to push past a major resistance zone around $91,000.
Bitcoin has recently been pushed higher by a sudden increase in open interest and the formation of a technical reversal pattern.
But much of the move seems to be derivative-driven rather than organic buying in the spot market, which is not sustainable.
Derivatives Surge Leads the Price Rally
According to CryptoQuant’s recent data, Bitcoin’s open interest has increased by 17.4% in 24 hours, the largest increase in months.
This is more than previous spikes of 16.4% and 15%, which happened in tandem with short lived rallies in Bitcoin’s price.
The spike in open interest, which is the total value of active futures contracts, was nearly $35 Billion.
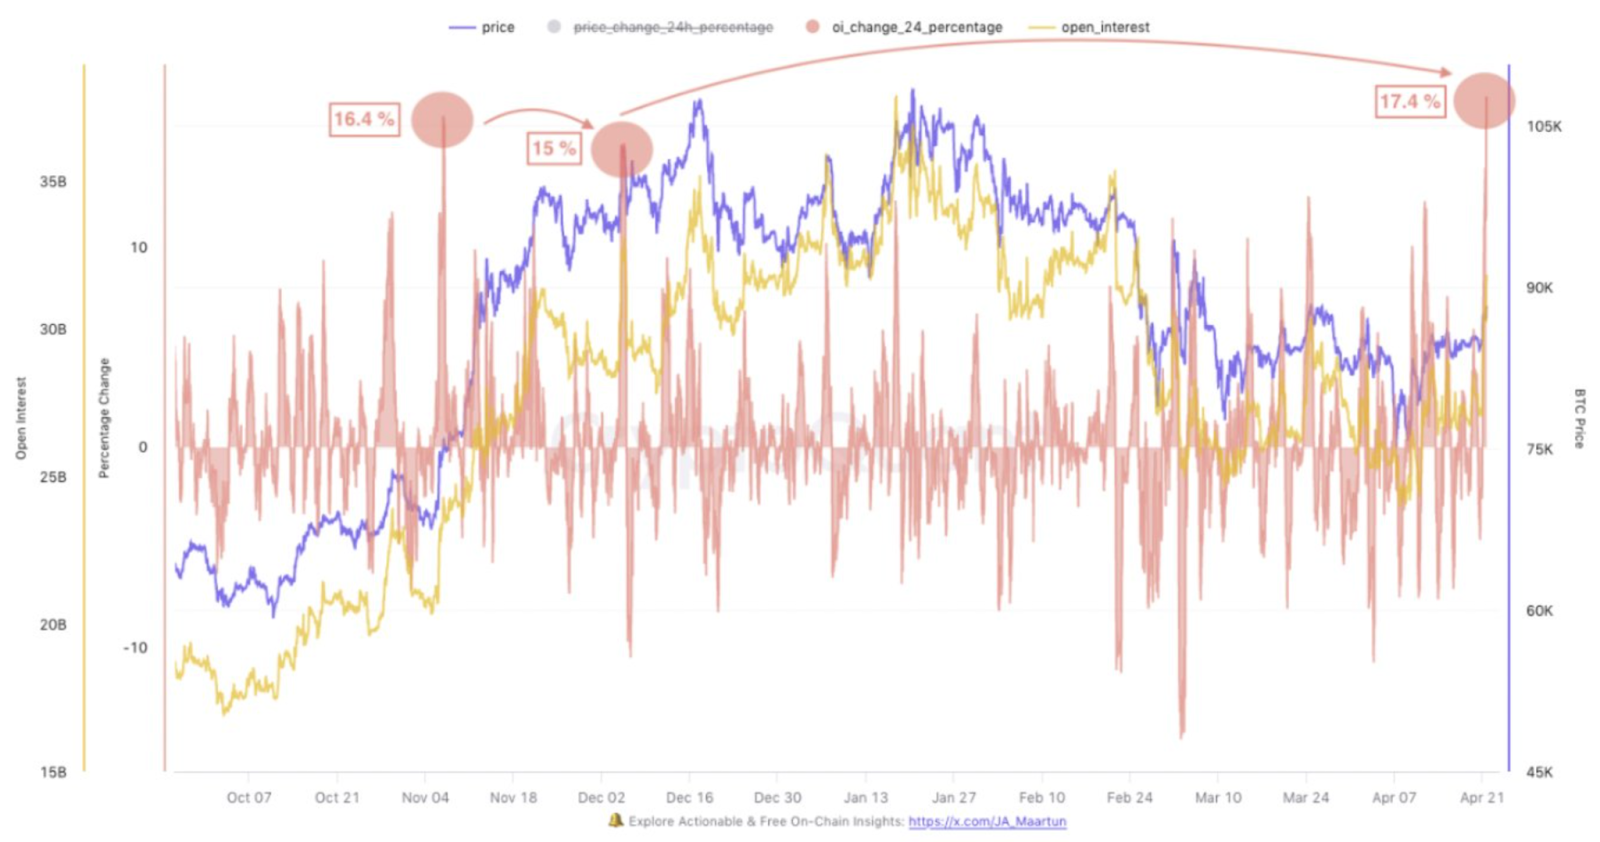
An open interest jump like this indicates increased trader activity and leverage, which typically results in higher volatility. “As we speak, we are seeing the largest 24h Open Interest increase in quite some time,” CryptoQuant analysts said. ‘Historically, pumps driven by derivatives are not sustainable,’”
This implies that the market is driven by speculative bets instead of real demand for spot Bitcoin.
If open interest increases without corresponding spot buying, the market is susceptible to corrections if long positions are liquidated or funding costs rise.
Slowing Momentum Near Resistance Zone
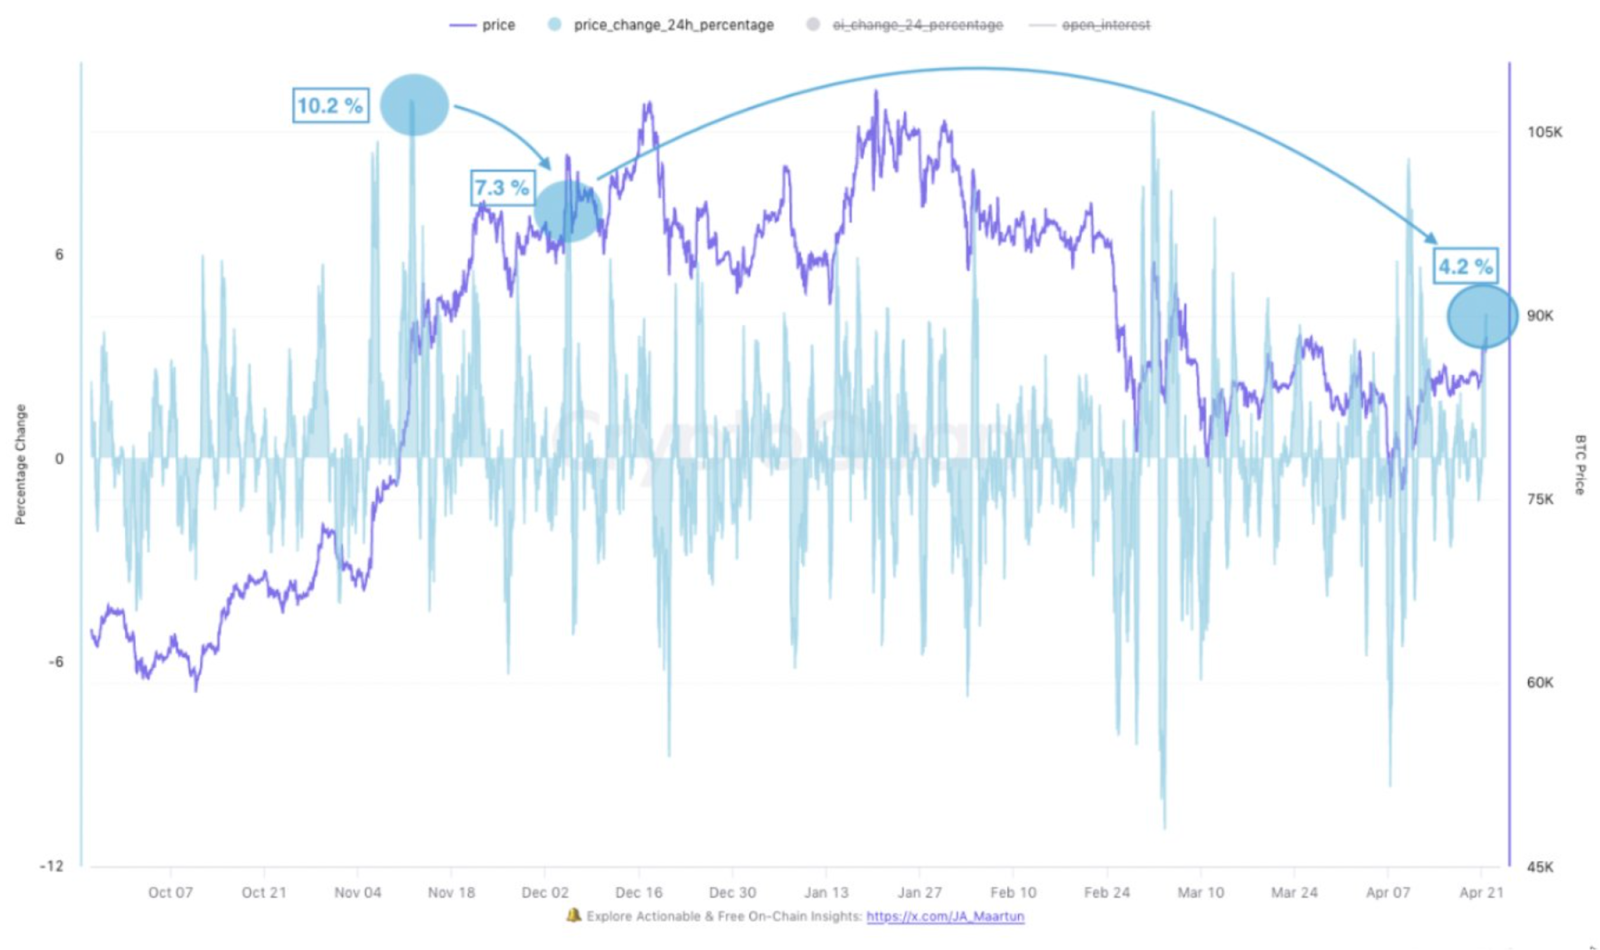
Furthermore, Bitcoin’s price has jumped 4.2% over 24 hours, which is less than the 7.3% and 10.2% increases earlier in this rally cycle.
The price approaching the crucial resistance range between $91,000 and $92,000 is slowing down, which implies that the momentum is dropping.
This range matches the trader’s realized price, which is in pink in on-chain charts. This line often acts as support in a strong bull trend.
However, it generally acts as resistance when the market is uncertain. Bitcoin is just below this level, and buyers need to come in for the trend to continue.
Bitcoin may see short-term pullbacks unless it gets confirmation of a move above $92,000. Volume and consistency above this level are being watched by analysts before a breakout is confirmed.
The Bull Score on the Chain is Moderate
Currently, the Bull Score Index, a market sentiment model from CryptoQuant, is near 75, which means that the market is still bullish.
Above 60 is generally considered positive market tone, while below 40 is bearish sentiment.
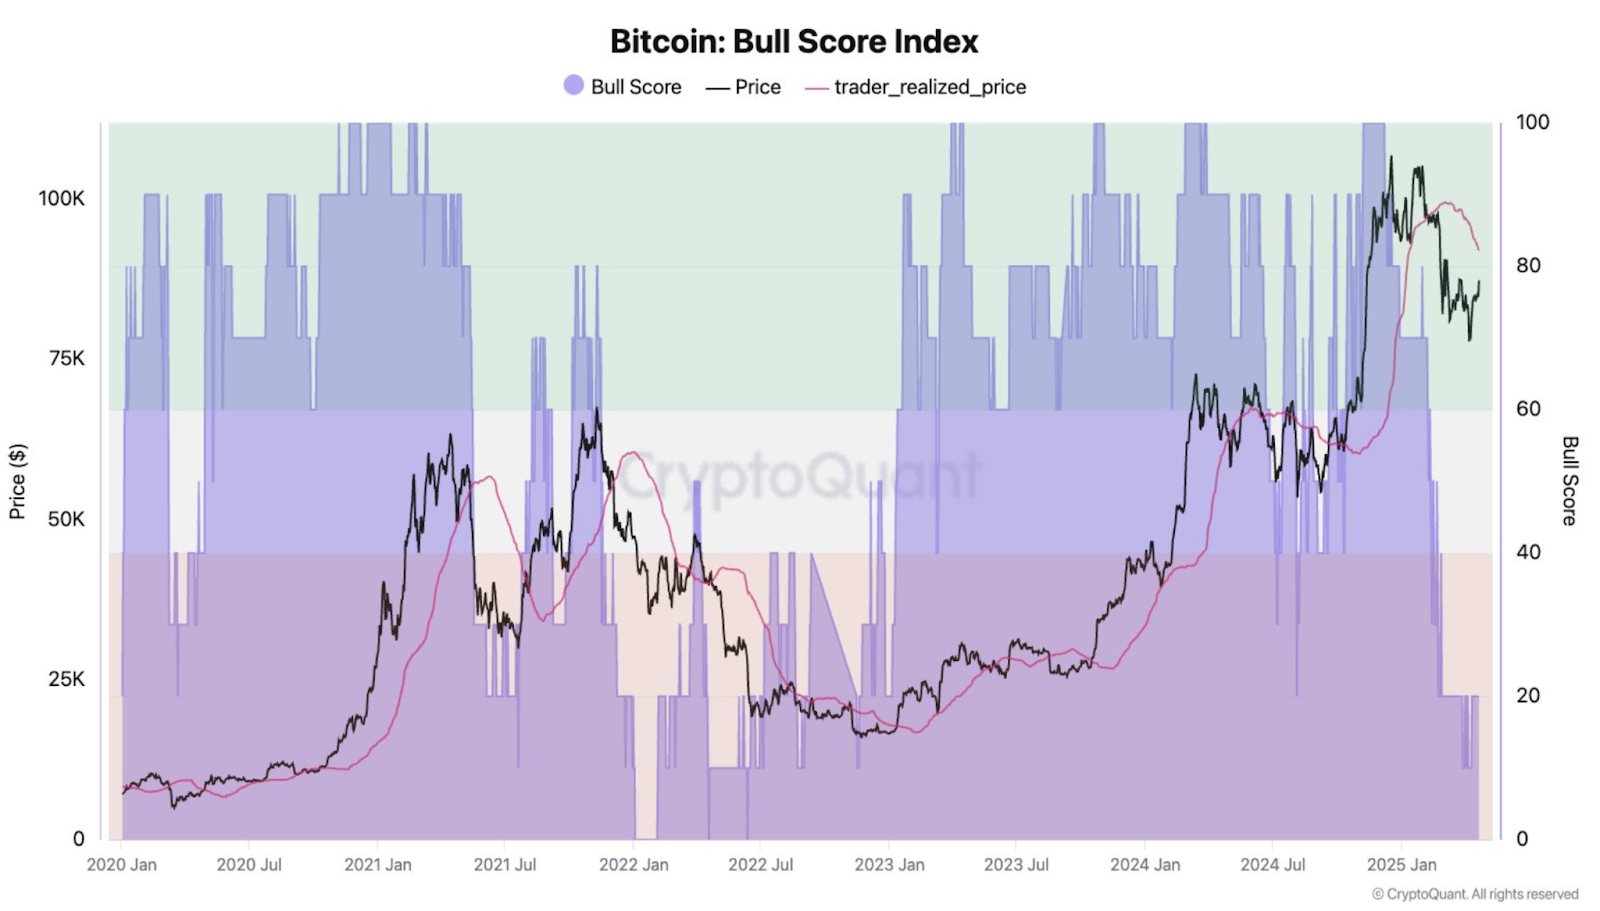
The bull score, though still in the upper range, has declined from earlier highs, indicating that sentiment has cooled a little.
Bitcoin’s price is still in the green shaded bullish zone, but a rejection at $91K – $92K will change that sentiment fast.
This index is a combination of various metrics that demonstrate if momentum is supported by the underlying fundamentals.
Although the current score is a positive one, it is still dependent on increased participation of spot buyers for the price to continue moving upwards.
Technical Chart Pattern Aligns with Price Behaviour
On the other hand, the recent breakout of Bitcoin is in line with a bullish inverse head and shoulders pattern on the daily chart.
It is a formation that is commonly seen during trend reversals and consists of three lows, one central ‘head’ and two higher ‘shoulders’.
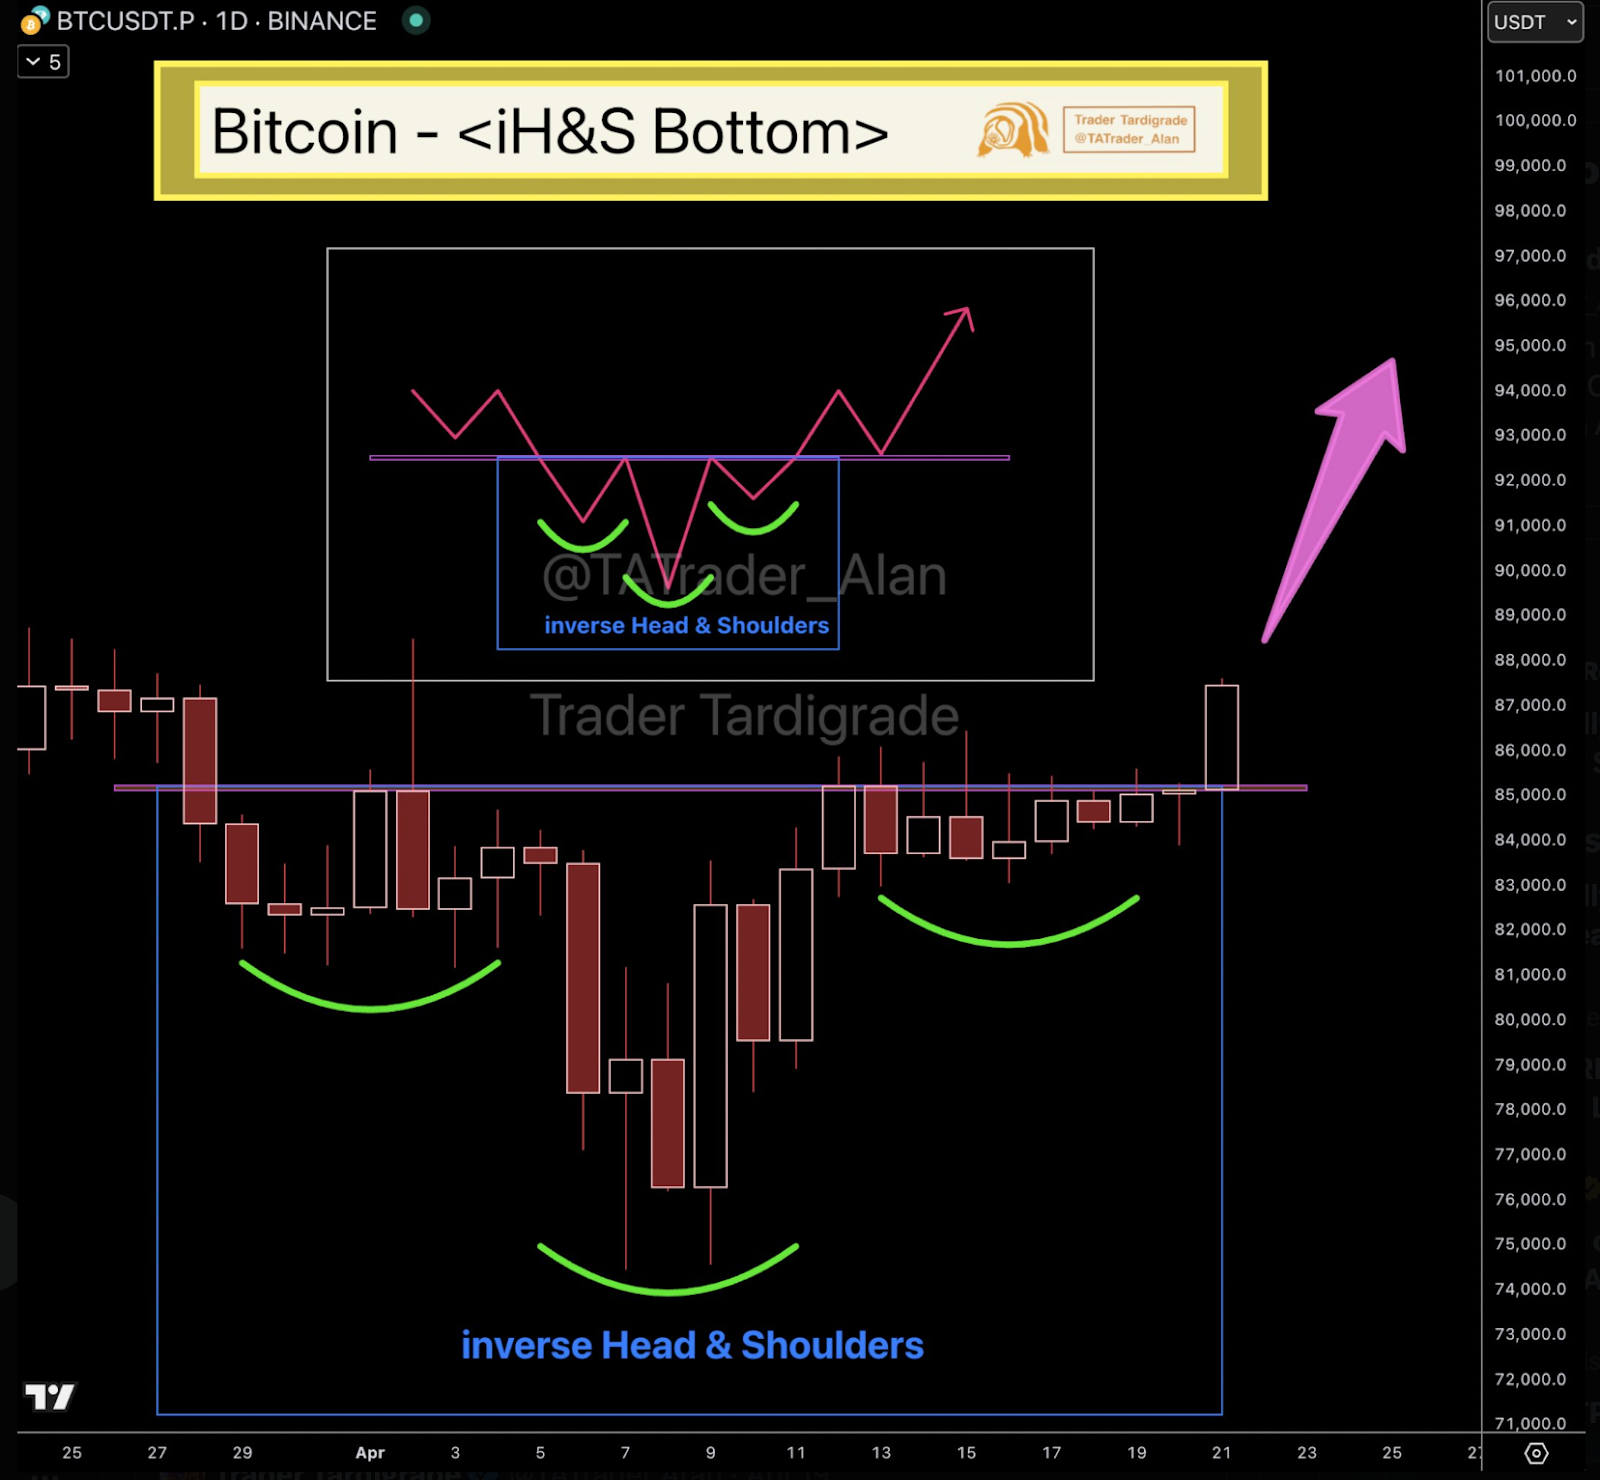
This pattern neckline was around $85,000, and Bitcoin has already surpassed it. A continuation of the breakout would take the target projection from this pattern to $95,000.