
Key Insights:
- Bitcoin remains in a strong uptrend but is currently facing resistance near the $94,000 level.
- The price of Bitcoin fell slightly to $93,311 on April 24, reflecting a 0.46 percent daily drop.
- Analysts predict a short-term correction that could push Bitcoin toward the $89,000 to $90,000 support range.
Bitcoin (BTC) remained in a strong uptrend but paused below a key resistance near $94,000. The market price rose by 1.93% to $94,546.46 during the day on April 25.
Market analysts expect a short-term correction before a new uptrend pattern emerges.
Yesterday, the price momentum slowed down during the rally as it neared the $94,000 resistance barrier. Multiple short-term indicators point to an impending price-drop which will move Bitcoin toward the $89,000 to $90,000 range.
The market movement presents a window for participants to assemble their positions ahead of a future increase.
Nevertheless, the present market slowdown failed to limit the evidence demonstrating market strength in the asset.
Many indicators in the cryptocurrency space confirm a positive long-term prospective for Bitcoin, and its valuation continues upward.
The asset faces new resistance during its current upward trend which hinders its continuous ascension.
Bitcoin Faces Strong Resistance Near 94K
Bitcoin showed signs of cooling off after reaching a local high near $94,000 earlier this week. The price experienced minor retracement during the initial Thursday trade session, when it stabilized close to $93,311.
Multiple price rejections had confirmed $94,000 to $95,000 as a notable resistance area when Bitcoin attempted to cross this zone.
Technical analysts pointed to this area as a likely barrier before Bitcoin could extend higher.
Analyst reports show that Bitcoin should fall back to the $89,000–$90,000 price level that functions as support.
The support zone between $89,000 to $90,000 will potentially become the foundation for more price increases throughout the coming sessions.
Further support exists at $83,000-$85,000 that would serve as a backup in case the first support fails to hold.
Bitcoin Holds Steady Above Key Support Level
Market participants continue to monitor Bitcoin’s behavior around the $89,000–$90,000 zone as it acts as key support. Analysts have deemed this price region as a potential trigger point for investors to return to the market. The support level stands out due to increased importance when market prices attempt to reach this resistance area.
If Bitcoin breaks below this initial support, further declines could lead to a retest of the $83,000–$85,000 range. The lower zone functions as a more resilient barrier which can control price fluctuations. A growing number of investors consider these price drops as areas where buying activity rebounds
Price movements over recent sessions show Bitcoin respecting previous resistance levels, which now appear to be acting as new support. The market signals maintenance of bullish force despite its current momentum reduction. The price finds steady backing from buyers who maintain their buying stance at these levels.
Uptrend Holds But Resistance Slows Gains
The overbought indicator of Relative Strength Index (RSI) shows 66.58, but still indicates potential short-term exhaustion of the market.
The MACD indicator maintains its upward trend because the MACD line maintains a sizable distance from its signal lines. The histogram continues showing positive values that confirm active momentum.
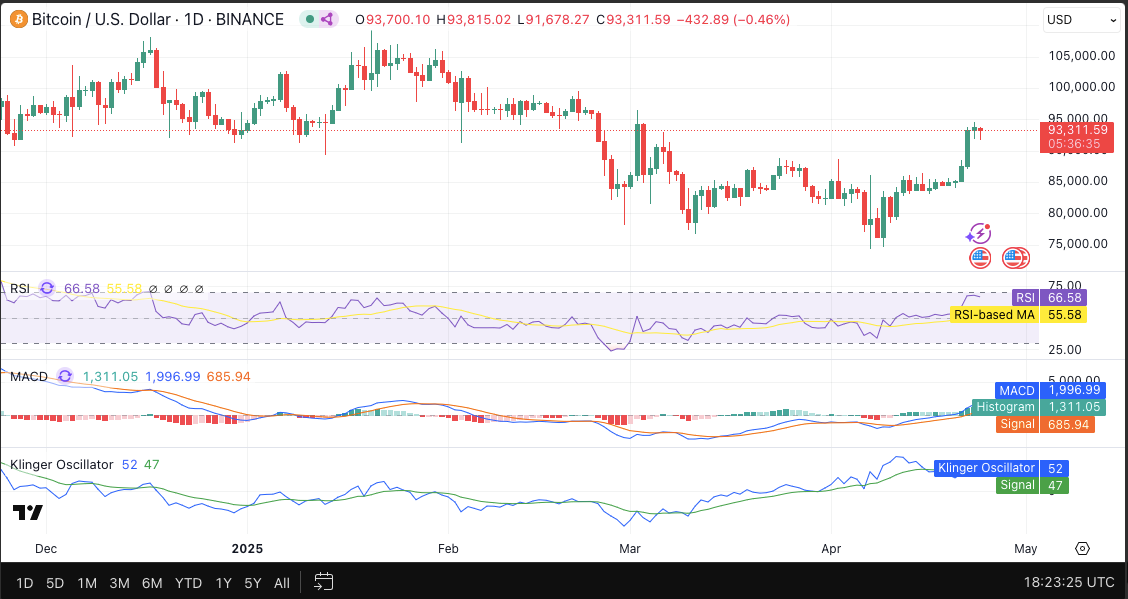
The Klinger Oscillator demonstrated a positive crossover because its main line outperformed the signal line.
Both positive and negative signals indicate market stabilization instead of a major price change. Present strength persists, yet signs of extreme bullishness might limit the immediate market rise.
The daily price movements maintain the upward trend by generating successive higher high and higher low patterns.
The present resistance levels show signs of constraining additional gains until a fresh upward force regains strength.
The market shows signs of going downwards rapidly as these circumstances develop.
Bitcoin Exchange Outflows Signal Strong Accumulation
The CoinGlass data highlighted continuous exchange withdrawals in April, which market experts interpret as accumulation behavior.
Evaluations from exchanges generated a significant $1 Billion withdrawal in March, as the recent price uptrend started just after that month.
The market supply becomes smaller when funds keep leaving the system, which leads to a tendency for price to rise.
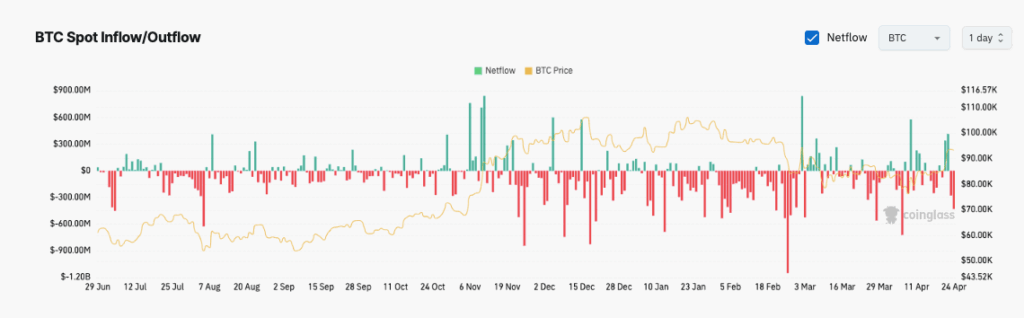
Exchange outflows continue to dominate over all other movements, with brief intervals of increased inflow activity.
The market demonstrates its expectation to hold assets throughout long periods. The reduction of exchange-held cryptocurrencies minimizes the selling force.
Such netflows suggest Bitcoin’s bullish trend remains structurally intact, even as short-term corrections emerge.
The movement of funds to private wallets matches up with industry-wide trends of reduced market liquidity.
The current configuration indicates that growth will resume after the market decline.