
Key Insights:
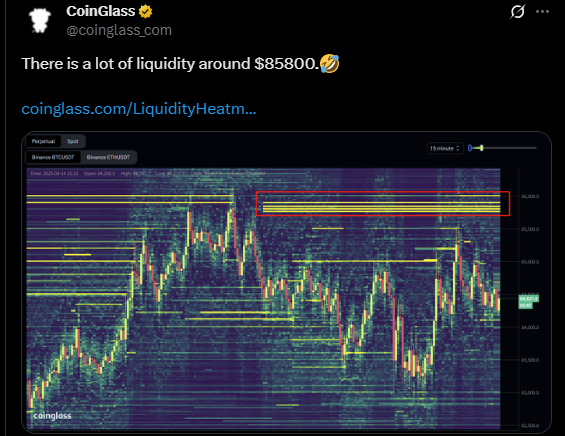
- Bitcoin has approached the $85,800 resistance level, where a high concentration of liquidity is building.
- The price briefly reached $85,787 before pulling back slightly, maintaining strength above the $84,000 support.
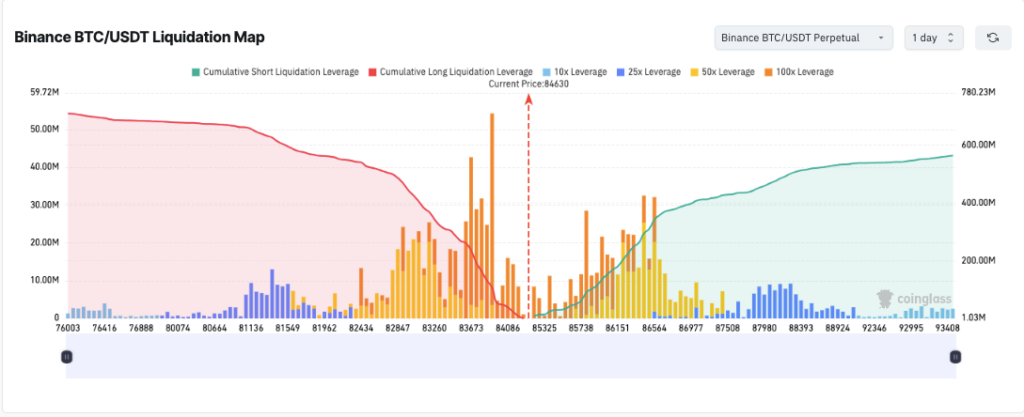
- Binance’s BTC/USDT liquidation map shows dense, high-leverage long positions between $83,000 and $84,000.
Bitcoin price remained strong, steadily approaching the $85,800 liquidity zone. This level is a key resistance point in the market. This BTC price range held a significant concentration of orders, hinting at potential volatility in the near term.
Market data showed high-leverage positions concentrated at key levels. This indicated potential liquidation events on both sides of the move.
Bitcoin price approaches $85.8K as Liquidity Builds Near Resistance
Bitcoin price action has moved toward $85,800, where much liquidity is concentrated. The $85,800 price level was an attention point due to the market’s stop and limit order clusters. Such price mobility above this zone should establish new momentum to probe higher market territories.
The market reached $85,787, showing intense upward pressure. This comes after traders rebounded from the earlier $80,000 low point.
Despite a minor decline of 0.48% in the past 24 hours, BTC remained above the $84,000 level. Market stability signs exist due to changing market sentiments and narrowing price fluctuations.
BTC/USDT liquidation map on Binance showed that many traders held leveraged long positions. These positions are concentrated in the $83,000 to $84,000 price range. Market pressure will rapidly intensify when sales increase because these strategic positions need to unwind.
BTC Faces Key Test Near $85,800
The $85,800 zone is notable in CoinGlass data for accumulating substantial liquidation activities. This level, tied to Bitcoin price movements, included long and short positions.
Short position trading activities have multiplied within the $85,000 to $89,000 range. This is due to liquidity surpassing the threshold, with leveraged positions ranging from 25x to 100x. This expose bears to risk if BTC breaks above this resistance with volume.
The market could start a liquidity hunt by triggering stop orders, which would cause leveraged traders to exit their positions. Market participants face significant price fluctuations when forced stop-loss orders are triggered. These liquidations occur at both the high and low ends of the market.
While Bitcoin price trades below the critical level, any upward move may target short liquidations to fuel a rally. The heatmap reveals potential risks for bulls when long leverage falls below $83,000. This is due to a sharp decline in assets within this price range.
Stopping moves beneath this specific threshold could result in painful downward momentum. Market traders are currently conducting a price struggle at the $84,000 pivot point.
Bitcoin Indicators Point Toward Upward Momentum
Market indications from the Relative Strength Index (RSI) stood at 52.09. This indicated a neutral position that lightly supports buying activity over the short term.
The 45.53 moving average showed positive development since price trends demonstrate rising power. BTC price established a stronger trend when it exceeded the RSI threshold of 60.

The MACD indicators demonstrated early bullish patterns through their signal successfully crossing the MACD line. The recent sessions showed a rise in buying speed following an increase in the histogram value to 531.
According to these crossover signals, the trend indicated an expanding positive trend for development. The Chaikin Money Flow (CMF) stood at 0.04, indicating a small but positive capital inflow into Bitcoin markets.
When the CMF value stays above zero, it suggests that the gradual accumulation of Bitcoin will continue. This data indicated that gradually building buying pressure offers better outcomes. In contrast, a sudden and aggressive purchase surge may be less effective.
Perpetual-Spot Gap Hints at Waning Bearish Sentiment for Bitcoin Price
The Perpetual-Spot Gap analysis by CryptoQuant showed a decreasing negative spread on the Binance exchange. The Perpetual-Spot Gap highlighted the relationship between futures and spot trading prices to evaluate market sentiment about leveraged positions.
Sellers have lost control of the futures market, causing the negative gap to persist. However, it is gradually becoming narrower.
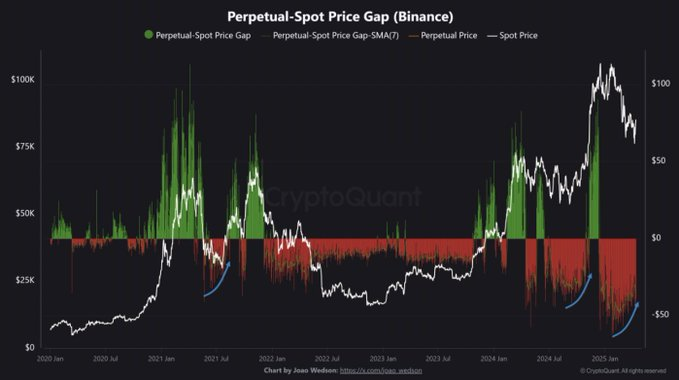
If market optimism rises, the Perpetual-Spot Gap will exhibit positive changes that could exceed resistance levels. Stockholders must integrate this pointer with volume readings and economic environment changes when making investment decisions.
Near-term market movements depend on changes in funding rates and shifts in derivative market opinions. Recent Bitcoin price action showed building momentum after bouncing from $83,010 on Sunday, following mixed macro signals.
The market exhibits stability through trader positioning that centers on significant technical zones. At the same time, it demonstrated its operational power. BTC price movement currently prefers to rise toward $85,800 in the medium term.