
Key Insights:
- Bitcoin experienced a sharp rejection at $86,496, triggering a 3.35 percent drop in price.
- The price declined to $83,369 as traders took profits and short sellers capitalized on resistance levels.
- Market momentum slowed further, with a 0.64% dip during Asian and European sessions.
Bitcoin faced a sharp rejection at $86,496, triggering a 3.35% drop and pushing the price toward $83,369. This decline comes as traders took profits, and short sellers acted at a critical price resistance level.
The next key level to watch is the $80,000 mark as price pressure increases. This could define the short-term trend.
Bitcoin Drops 3.35% After Rejection at $86K
Bitcoin failed to hold above the $86,000 mark, sparking a decline of more than 3% from its recent high. Bitcoin experienced its initial downtrend during U.S. market hours. The decline later slowed down during Asian and European trading sessions.
Today’s market performance demonstrated a reduced downfall of 0.64% as Bitcoin maintained a price position at $83,369. BTC’s recent high at $86,496 was a major technical obstacle when traders started dumping assets strongly while initiating short contracts.
Technical traders used this resistance level as their chance to close profits from their long positions before additional market declines. The upward trend has lost power because BTC has settled under its short-term moving average indicators.
The inability of BTC to surpass $84,000 indicates doubtful market psychology. Investors lack sufficient trust in the market’s direction. Market participants are focused on the $80,000 support level.
It needs to hold for the current market movement to sustain itself. Market-wide price adjustments could occur after a drop below this specific price point.
On-Chain Metrics Signal Potential for Deeper Correction
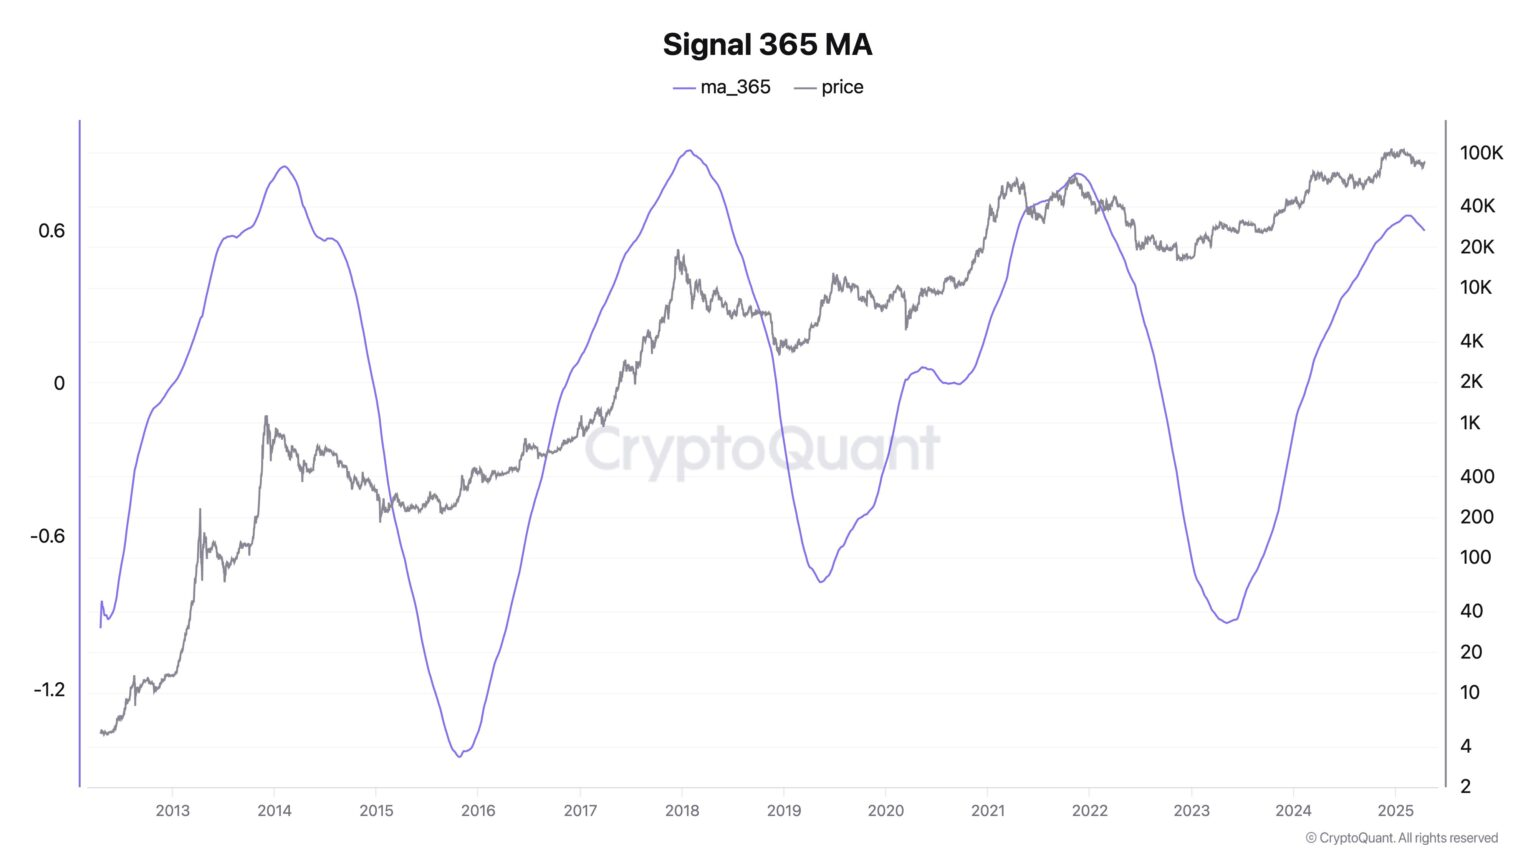
According to on-chain data, BTC supply continues to outpace demand, pointing to a possible top in the current cycle. CryptoQuant’s founder provided a supply-demand chart demonstrating accurate past market cycle predictions.
It also highlighted bearish behavior in the current market conditions. When demand stays weak, prices may decline further into different support levels.
The bearish outlook supports Santiment’s Network Realized Profit and Loss (NPL) data. This indicated investors had captured profits since early December.
The historical analysis demonstrated that this metric creates peaks right before market tops, together with weakening momentum during price surges.
The market showed no contrary movement from its December 5 peak as NPL returned to a neutral position. This indicated that profit-taking forces faded without causing an inversion.
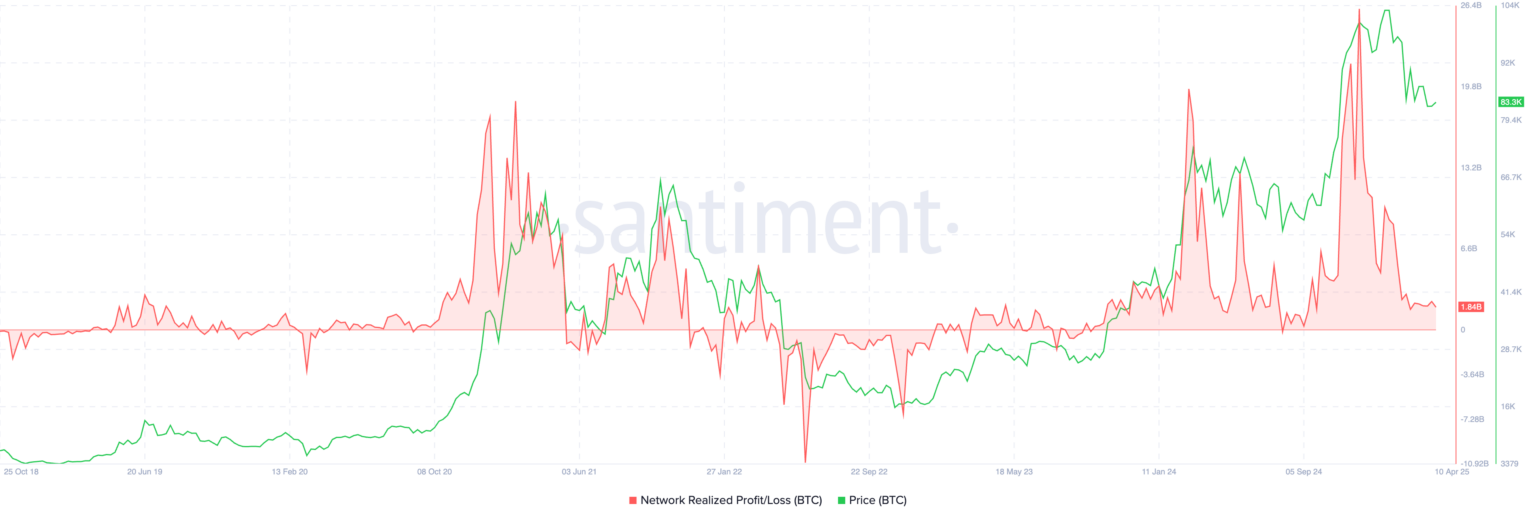
Negative NPL readings emerged after significant market increases during previous bear and bull cycles. This occurred when investors sold their holdings at heavily discounted prices.
The 2021 figures for NPL reached their yearly high of $18.63 billion. After that, it fell into a—$1.83 billion deficit, establishing the year’s low. Current data indicate that BTC may need to see another deep drop in NPL before a strong rebound begins.
Traders Target $65K as Key Support Zones Reappear
Several well-known traders now expect Bitcoin to revisit lower levels between $70,000 and $60,000 before any sustained recovery. The short position highlighted on social platform X targets $65,000 in price action.
It provides evidence using bearish graphics and momentum trading features. These setups rely on BTC failing to hold the $80K support in the coming sessions.
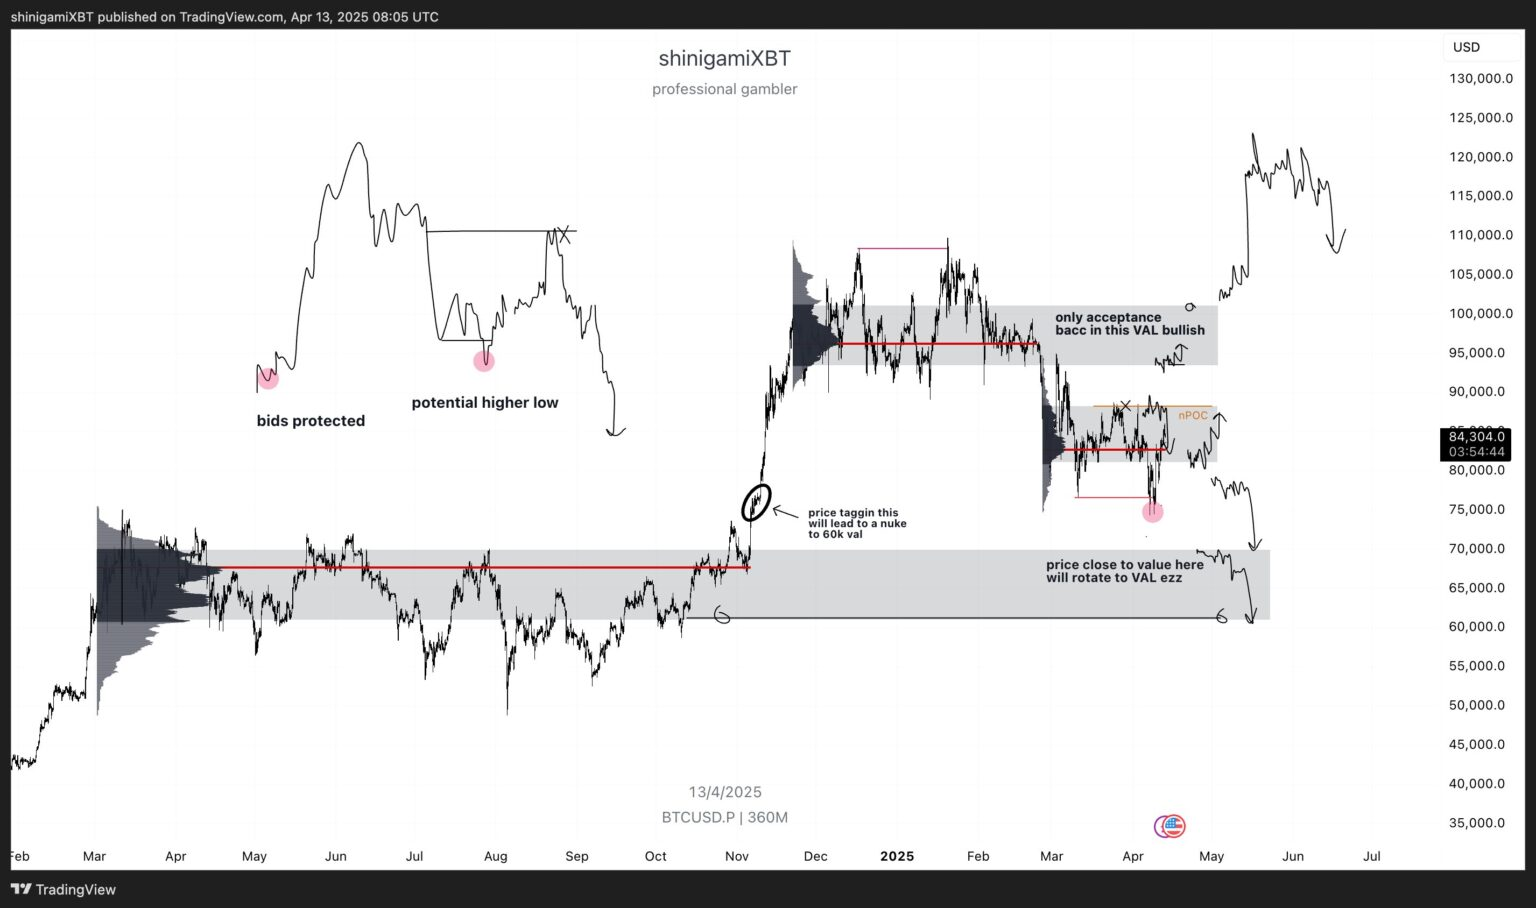
Analysts identify key price areas for present-day consolidation between $80K and $86K. On a long-term basis, price zones around $70K to $60K, established in 2024, are also significant.
The failure against the upper consolidation band establishes resistance, which makes traders believe the critical support will be $80,000. If this level breaks, BTC could quickly fall back to test historical demand zones.