
Key Highlights:
- Bitcoin is back under $80K; it tested its 50-week SMA and market structure.
- Volume spikes suggest buyer strength as VWAP sits near $79.2K.
- CME gap at $85.2K remains open as the price eyes key resistance levels.
Bitcoin has printed a second strong bullish candle. However, it now hangs on to the 50-week support zone. BTC is nearing a significant market structure and approaching the open CME gap at $85,245, reflecting intensified market activity.
The surge in trading volume highlighted the test of key price levels. This signaled potential shifts in price dynamics.
Support for Bitcoin Seen Near $69,500 on Mayer Multiple Chart
Glassnode’s Mayer Multiple chart provided a long-term view of Bitcoin price concerning its 200-day moving average (200DMA).
At the time of writing, BTC was trading at $79,510.28, while the 200D MA was at $85,067. This indicates that Bitcoin is still below a significant trend resistance.

Support was near $69,519, the 0.8 oscillator band in the chart. The red upper band, the 2.4 oscillator, suggested a top in the works near $208,557.
In the past, when Bitcoin traded close to the lower oscillator (0.8), it was supported and recovered. Bitcoin has so far been contained within these bands, which may be a guide to future price action.
The Mayer Multiple itself is the current price divided by the 200DMA. It helps to show when Bitcoin is overbought or oversold relative to long-term trends.
As the price is below the 200DMA, the market could still be in a consolidation phase. Also, a move above the 200DMA could indicate renewed strength.
Volume Spikes and VWAP Fluctuations Signal Active Buying
Meanwhile, CryptoQuant’s VWAP and 24-hour price change chart indicate that April has returned to active trading. Bitcoin printed two bullish “mega candles” with high volume on two separate occasions, marked as #1 and #2.
The orange bars above the 240K BTC mark were the first spike. This spike came around April 7th and another one around April 10.
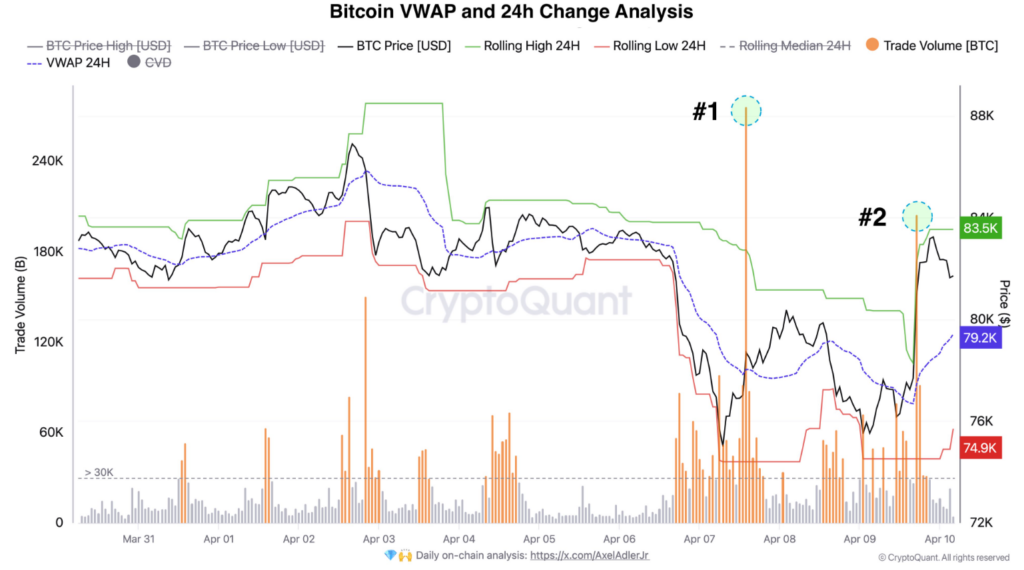
During these moves, Bitcoin moved from a low of nearly $74,900 to a short-term high of $83,500. The VWAP (Volume Weighted Average Price) is the blue dashed line sitting near $79,200.
As VWAP is a measure of average price based on volume and price, trading above it usually means buyers are in control. The volume surges and sharp price recoveries imply buyers are actively near current prices.
More support is needed if the price remains above VWAP and the volume is high. However, traders may wait for a lower entry or confirmation of trend continuation if volume weakens.
BTC Battles Major Support—A Break Could Bring 2-Year Trendline Into Focus
Moreover, Bitcoin’s current price action tests the 50-week Simple Moving Average (SMA), a central long-term trend line. According to Titan of Crypto’s analysis, the token is also close to an area of past market structure.

This is the support structure that was created by previous price tops. Long-term investors may be encouraged to buy further if the 50-week SMA holds.
If Bitcoin price drops below this level, the 2-year trend line becomes a key area to monitor. Another crucial zone is the lower edge of the Ichimoku Kumo Cloud.
The Kumo Cloud can be both support and resistance, depending on the price trajectory. A deeper pullback or longer consolidation may result from a breakdown into the cloud.
CME Futures Gaps Provide Short-Term Price Targets
Furthermore, Titan of Crypto also has another chart showing Bitcoin’s CME Futures price gaps. These gaps are created when Bitcoin closes at one price and opens higher or lower the next trading day.
The chart showed one gap, nearly $82,300, that has been filled. However, there was another gap that is still open at $85,245.
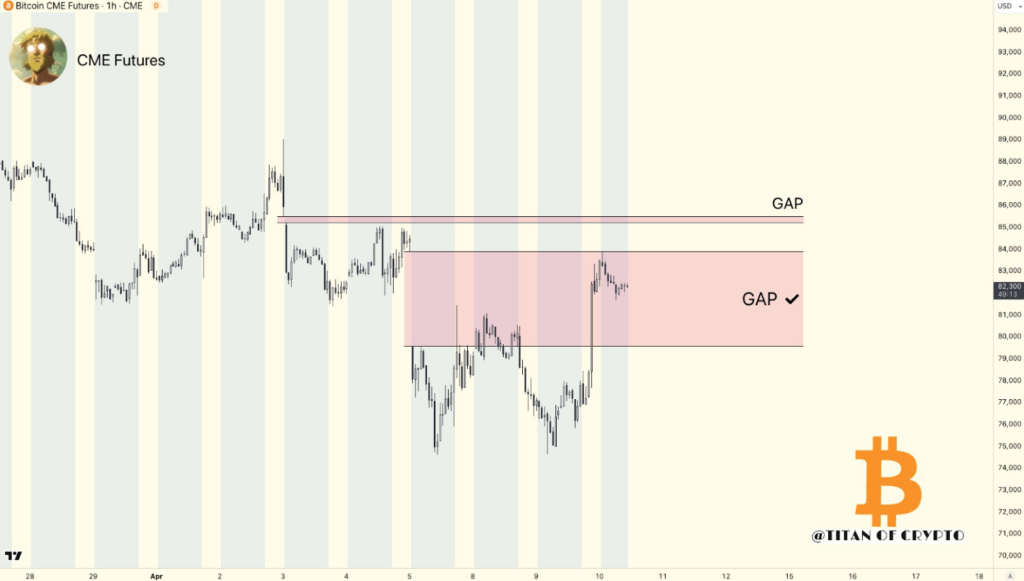
Markets tend to ‘fill’ these gaps by revisiting those levels, and these gaps often attract price. Resistance could be found if the price gets here unless volume and momentum are substantial.
Futures gaps do not always fill immediately, but many traders watch them as essential levels. This could be a move toward $85,245. It aligns with the resistance from the 200DMA mentioned earlier, a critical zone in the short term.