
Key Insights:
- Bitcoin remains above $80K with reduced volatility and smaller drawdowns than past bull cycles
- Gold reaches a new all-time high of $3,300 amid rising demand for hard assets
- On-chain data shows BTC supply in profit near long-term average, signalling market equilibrium
Global financial markets are adjusting to shifting trade dynamics and rising interest in hard assets as Bitcoin continues to trade above $80,000.
Glassnode’s new data shows realized profits and losses in the Bitcoin network are close to long-term averages even as macro uncertainty grows.
Meanwhile, gold has hit a new all-time high near $3,300, and Bitcoin’s performance relative to gold is getting fresh attention.
While several long-term on-chain indicators suggest that this cycle is different from past extremes, the price movements have been tighter and investor behaviour more measured.
Realized Profit and Loss Metrics Show Market is at Equilibrium
The “BTC: Realized Cap by Profit and Loss” is a chart of the total realized value of Bitcoin broken down by profit and loss.
Darker shades of orange and red during the 2022 bear market were indicative of steep drawdowns, and realized losses peaked.
Unrealized losses hit an all-time high of $410 Billion at one point.
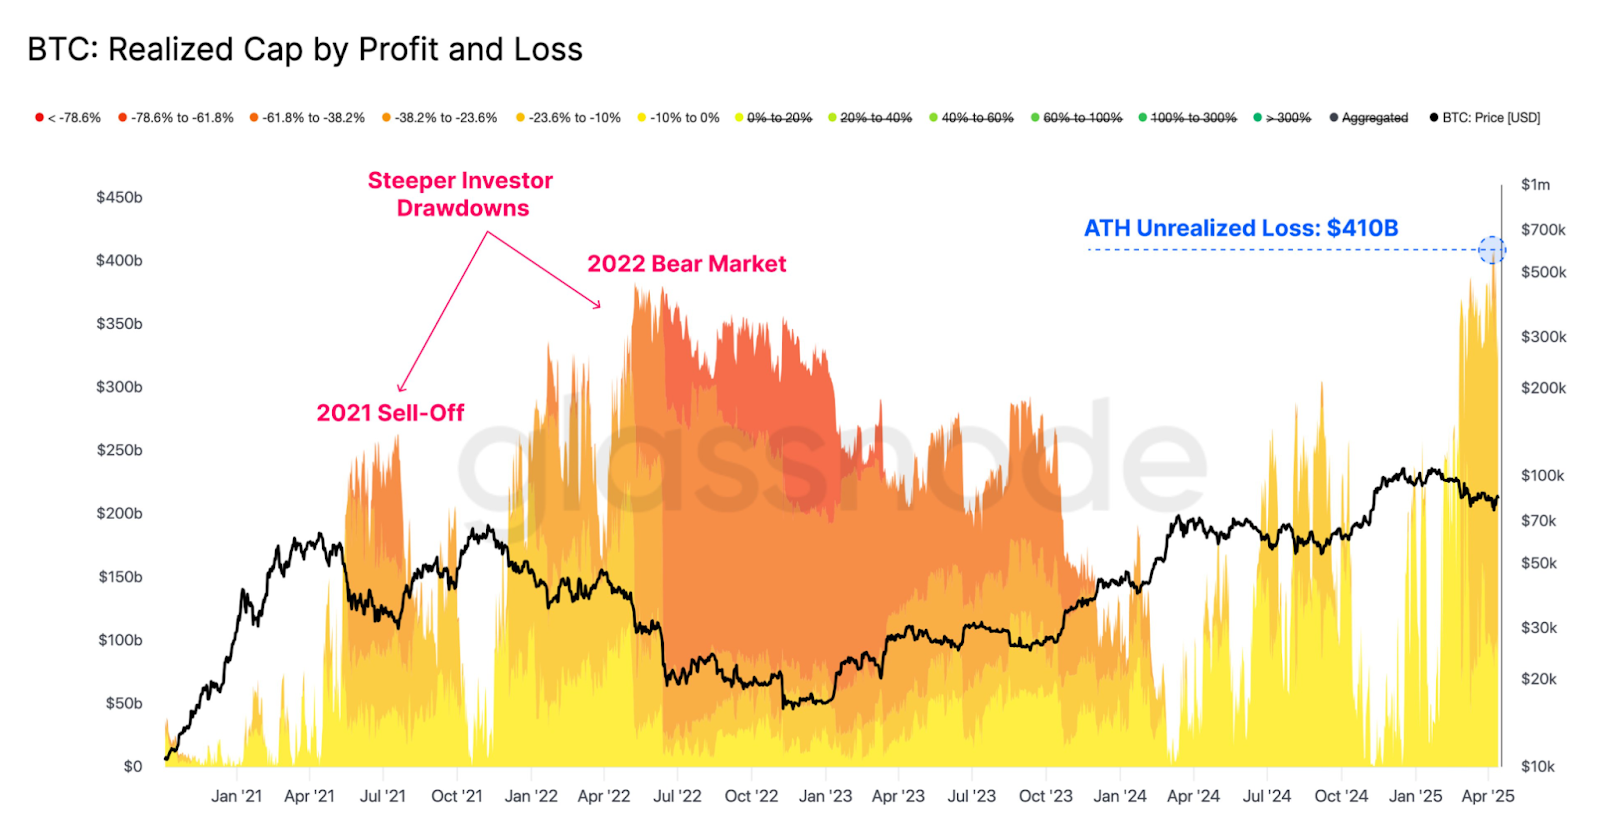
The chart is currently showing lighter shades, meaning more holders are now in profit or have smaller losses.
Realized losses are smaller and more stable compared to previous cycles, such as the 2021 sell-off or the 2022 bear cycle.
This implies that the market is less aggressive in selling and is more balanced.
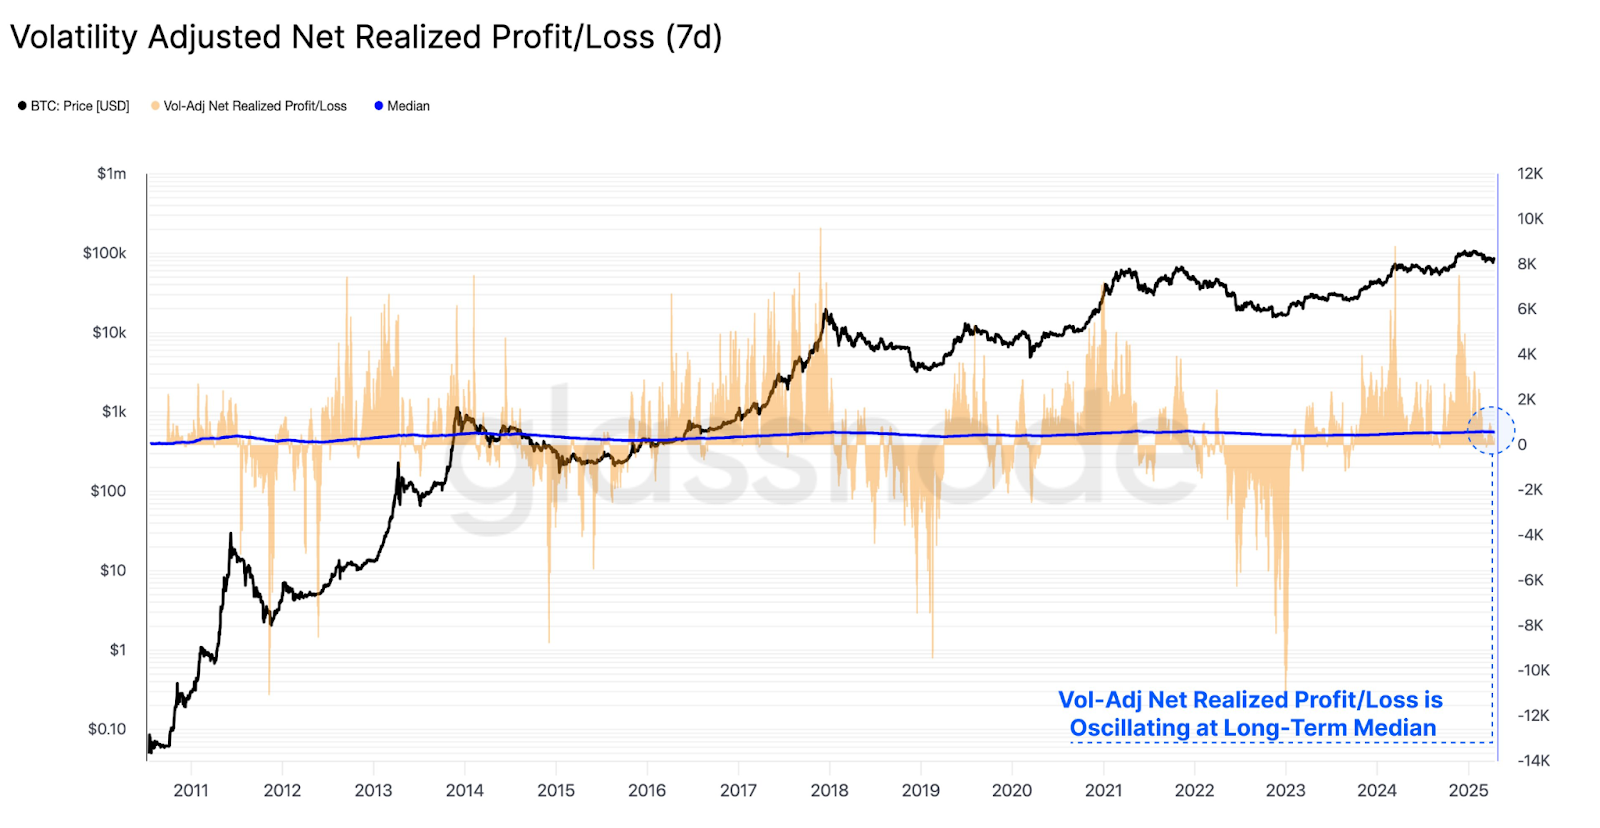
Additionally, the “Volatility Adjusted Net Realized Profit/Loss,” shows that Bitcoin’s profitability is now swinging around its long-term median.
The blue median line is centred around the orange bars, which indicates that net realized profits or losses are not very extreme.
It also indicates a stable period of investor sentiment, with the emotions of panic or greed appearing to be reduced.
Current Bull Market Drawdowns Remain Historically Low
Conversely, the drawdown shows how much price correction has taken place in each bull market phase.
Colored zones represent each cycle’s median correction.
In the 2011 bull cycle, there was a 22% correction, and in the 2015 to 2017 cycle, there was an 18% drawdown.
In the 2019 to 2022 cycle, the peak levels saw a 19% correction.
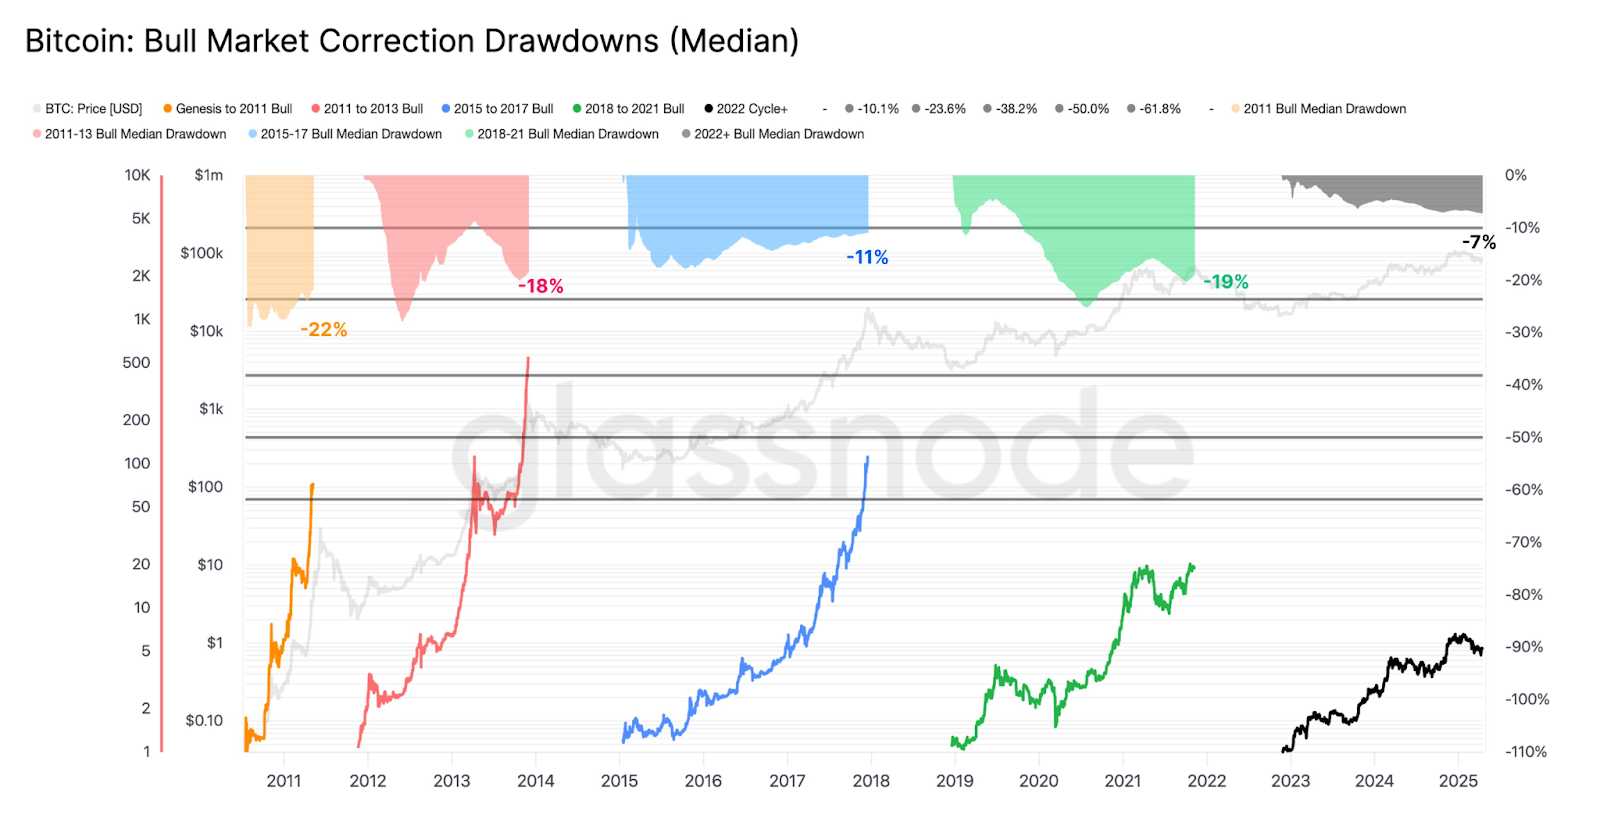
Bitcoin’s median drawdown in the ongoing cycle from 2023 to 2025 is just 7%.
The lower figure, therefore, indicates that the current bull phase has thus far seen more moderate pullbacks.
The current correction has been more resilient compared to earlier cycles, where corrections were sharper and deeper.
This could be due to more institutional involvement, better liquidity, or more disciplined investor behaviour.
Percent of Supply in Profit Near Mean Range
Additionally, the “Percent Supply in Profit Oscillator” indicates how much of the circulating supply of Bitcoin is currently profitable.
In the chart, the orange line is the 7-day moving average of this percentage. The orange line is currently around the mean of 75%.
This makes the market an equilibrium state. In previous bull cycles, this metric has often signalled overheating when it moves above 91% (+1σ).
On the other hand, values below 59% (-1σ) have coincided with bear market bottoms.
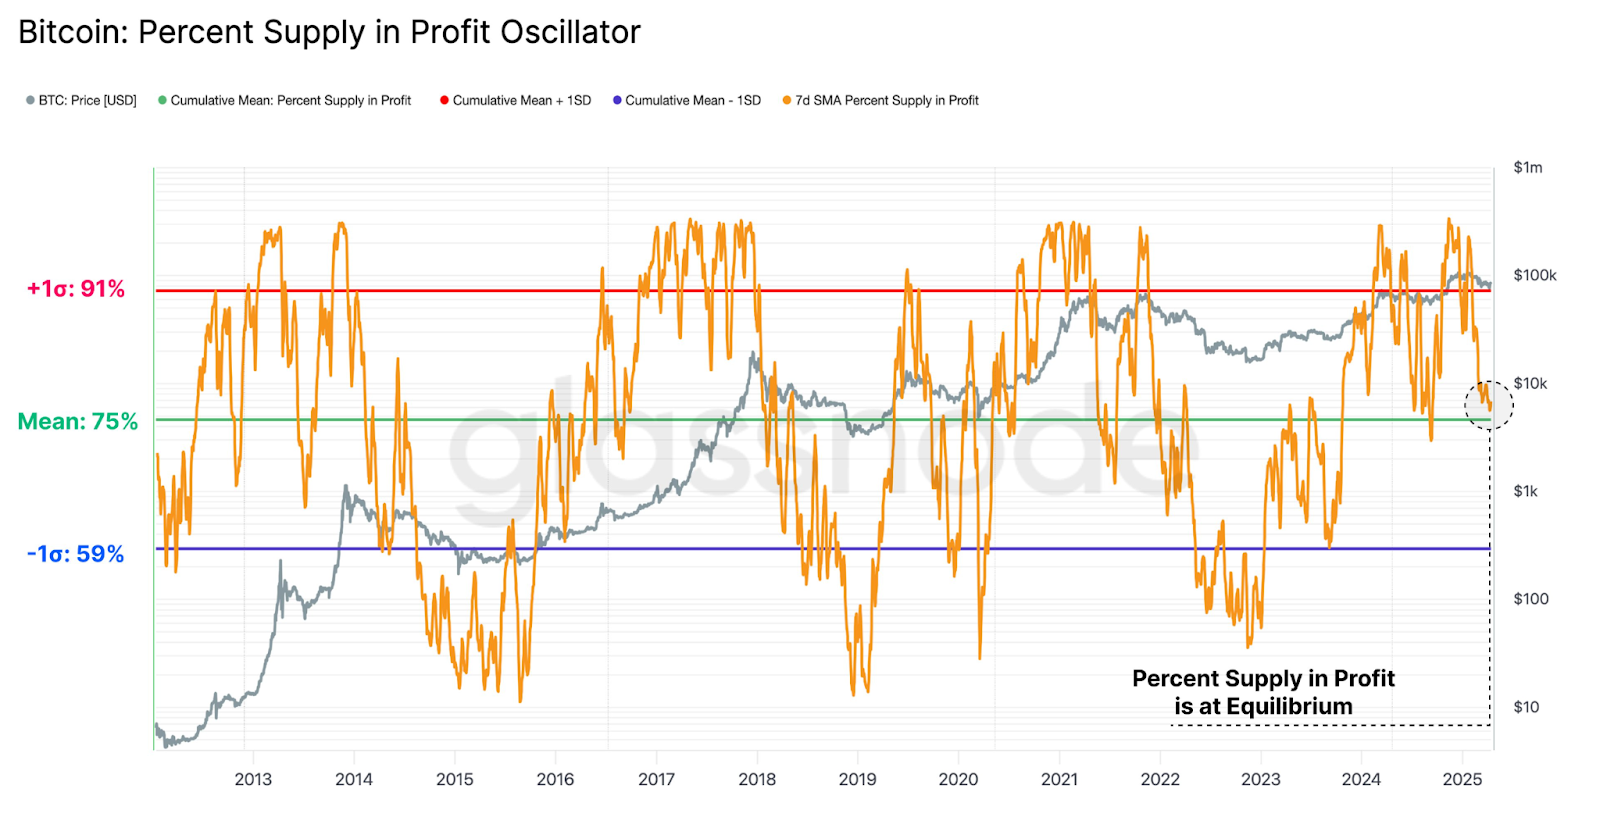
The data indicates that Bitcoin is not overheated, nor is it deeply undervalued, as the supply in profit is close to its historical mean.
This supports the notion of a consolidating market where both buyers and sellers are tentative, but not overly so.
Bitcoin-to-Gold Ratio Shows Steady Performance Against Traditional Safe Haven
The Bitcoin to Gold ratio is the amount of ounces of gold needed to equal one Bitcoin. It has moved in cycles historically.
The ratio was at its peak in 2011, 2013, and 2017 when Bitcoin was rallying big time.
It fell sharply after each peak and slowly recovered as Bitcoin built up another cycle.
The Bitcoin-to-Gold ratio is shown to be at relatively stable levels as of April 2025.
As gold recently broke above $3,300 per ounce, this means that Bitcoin is holding value better against gold.
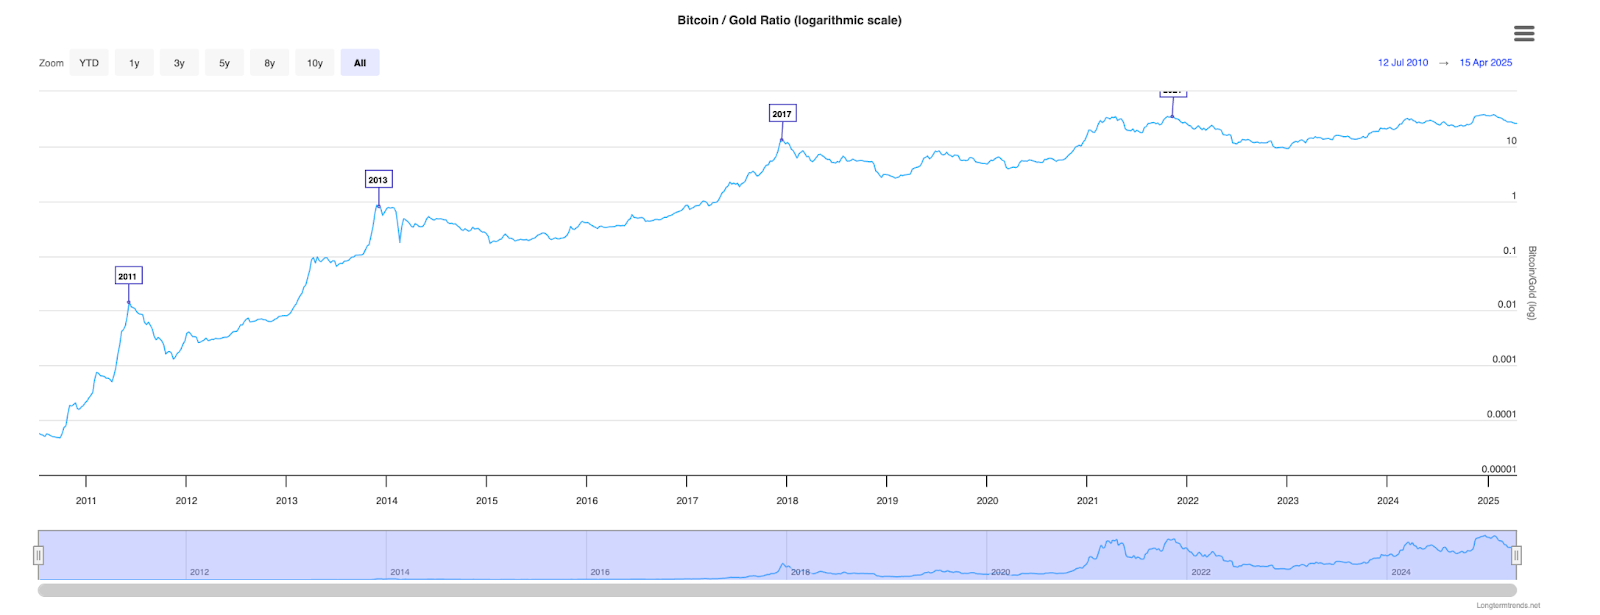
The steady ratio implies that Bitcoin has not been outperforming gold in the recent months, but it has been playing its role as a store of value.
When both assets are rising, the broader context is that of stronger demand for scarce, non-sovereign assets during macroeconomic uncertainty.