
Key Insights:
- BTC must defend $87.5K Alpha support or face a likely drop to $75K.
- Short-term holders are not selling—NUPL at just 8%, far from the 40% risk zone.
- Global liquidity is rising again, fueling potential BTC rally continuation.
Bitcoin is holding on to the critical $87.5K Alpha support level, while historical data suggests a possibility of falling to $75K if it breaks.
At the same time, short-term holders aren’t selling, and increased global liquidity may have more bullish momentum in store for BTC.
Bitcoin Holds Above Key Alpha Support Level
Bitcoin is now trading just above $95,000, holding onto a key support level defined by the Alpha Price model. This model uses layered bands to reflect key on-chain pricing levels, as per data from Alphractal.
Now, the final support zone is the $87,500 price level. Historical data suggests that if it breaks, Bitcoin will likely drop to about $75,000.
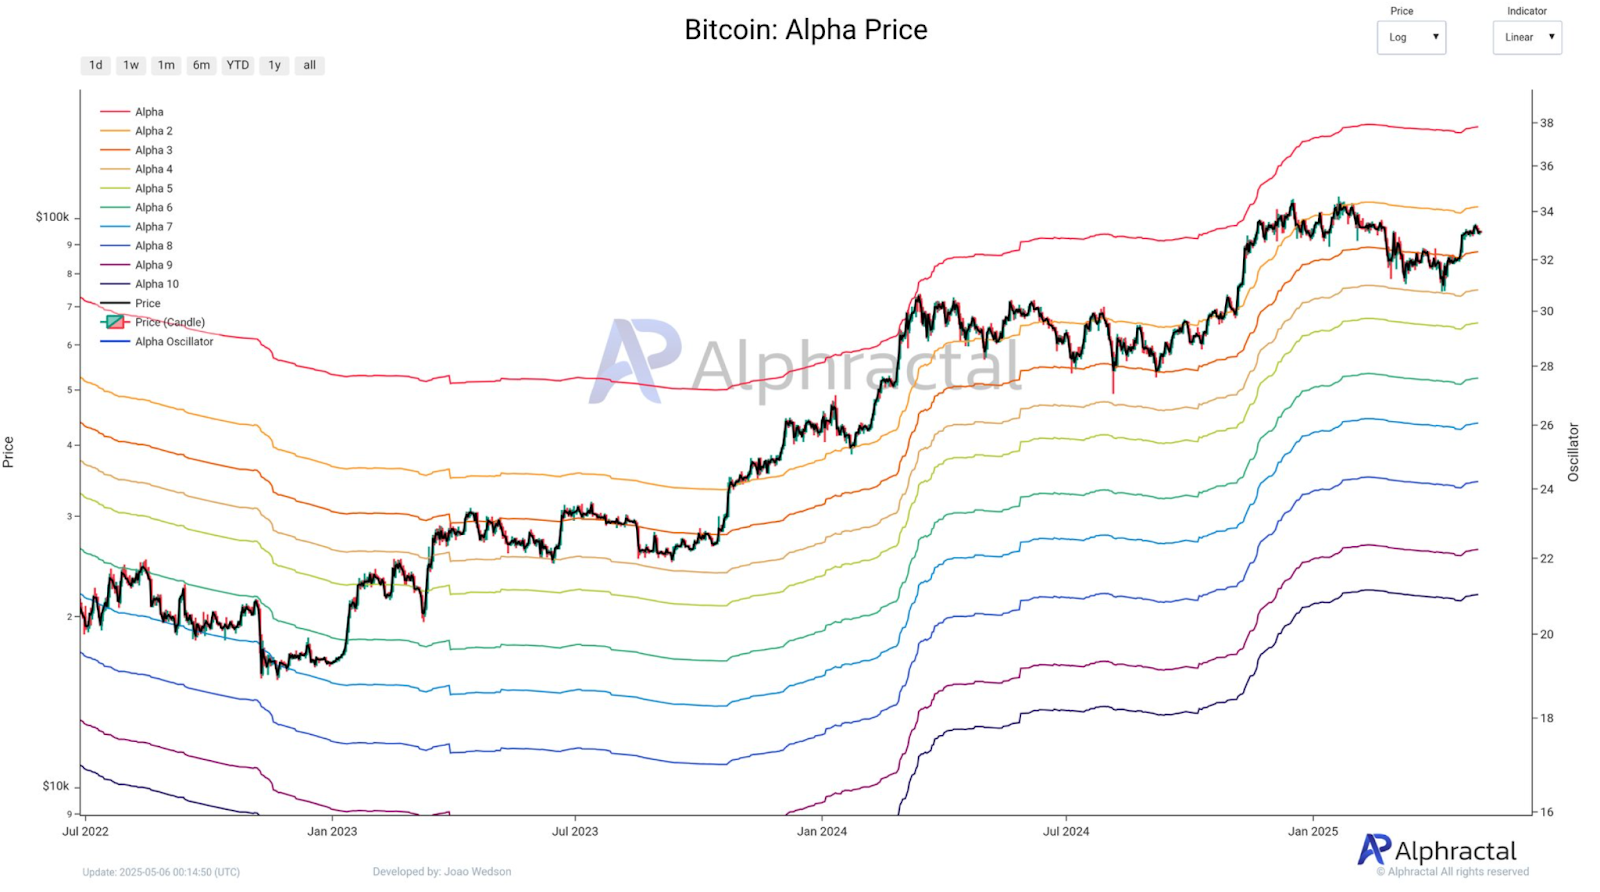
These Alpha levels (Alpha 1 to Alpha 10) are derived from long-term fractal behaviour and historical on-chain metrics. Alpha 3, is now close to the $87,500 mark, which has been holding strong since early 2025.
Bitcoin has not fallen below this level since breaching it in mid-April. This is something traders should keep an eye on. The update warns that if $87,500 breaks, “there’s a very high probability we’ll also lose the $75K level.”
Short-Term Holders Show Minimal Selling Pressure
Another key indicator in the current market is the behaviour of short-term holders, those holding Bitcoin between one and three months. Institutional traders and speculators using ETFs are often these investors. They tend to sell when profits exceed a certain level, putting pressure on the spot market.
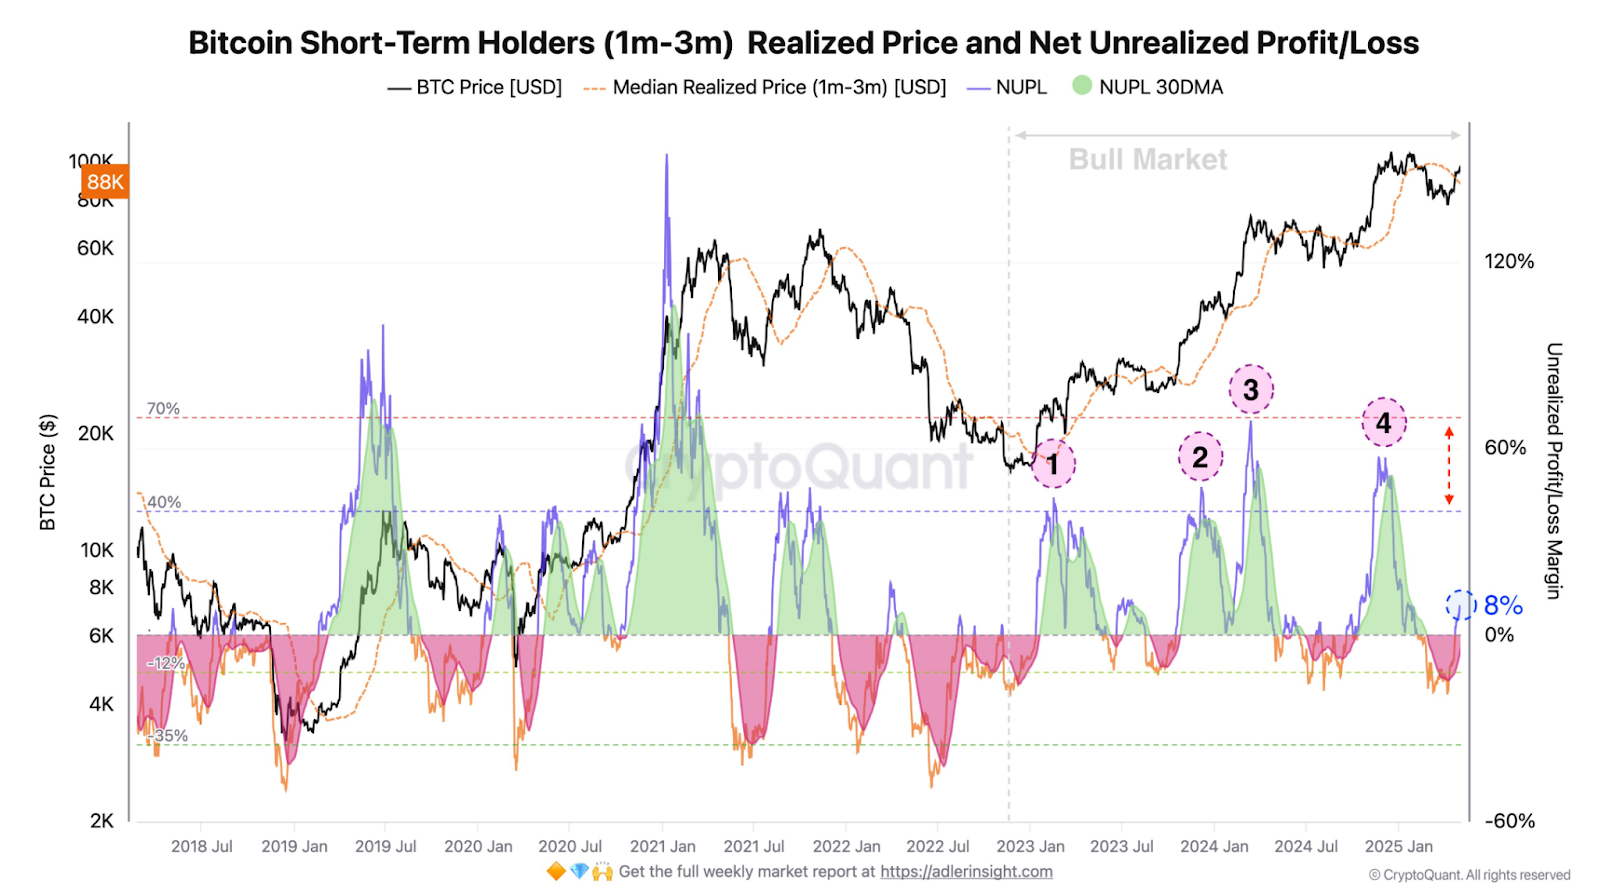
As of now, their Net Unrealized Profit and Loss (NUPL) is at just 8%, and the 30-day simple moving average (SMA) is still negative at -2%. This is far below the usual 40% level at which this group typically begins to sell.
This cohort is not actively taking profits yet, according to the data. During these expansion periods, Bitcoin’s price has tended to climb, as was the case in 2019 and 2020–2021, following similar liquidity growth.
Looking at the patterns from 2018 to 2025, every time the NUPL has crossed 40%, Bitcoin has had a pause or correction right after. Because current levels are so much lower, these holders are not likely to sell immediately, and further upside could continue.
Long-Term Alpha Trends Suggest Strength
The historical data from the Alpha Price model suggests that Bitcoin is still in the healthy long-term range. Looking at a broader chart of Bitcoin since 2010, it’s obvious how the asset has always respected the Alpha Price bands in all previous bull and bear markets.

Bitcoin repeatedly bounces off lower Alpha bands and climbs back to the upper bands in the chart. There has been a peak near Alpha 1 or Alpha 2 in each cycle. In May 2025, Bitcoin is trading closer to Alpha 2, historically a mid- to upper boundary during bull markets.
Another tool from Alphractal, the Alpha Oscillator, is also below the red zone, which in the past has signalled price tops.
The oscillator is at level 6, below the overbought range of 8 to 9. That implies that the market has not yet peaked.
Liquidity Trends Align With Bullish Momentum
Global liquidity is another supporting factor. Another chart from Coinvo shows global M2 money supply growth from central banks such as the Federal Reserve, ECB, GBM, CNM and JPMorgan. Historically, Bitcoin price has tracked increases in global M2 liquidity.
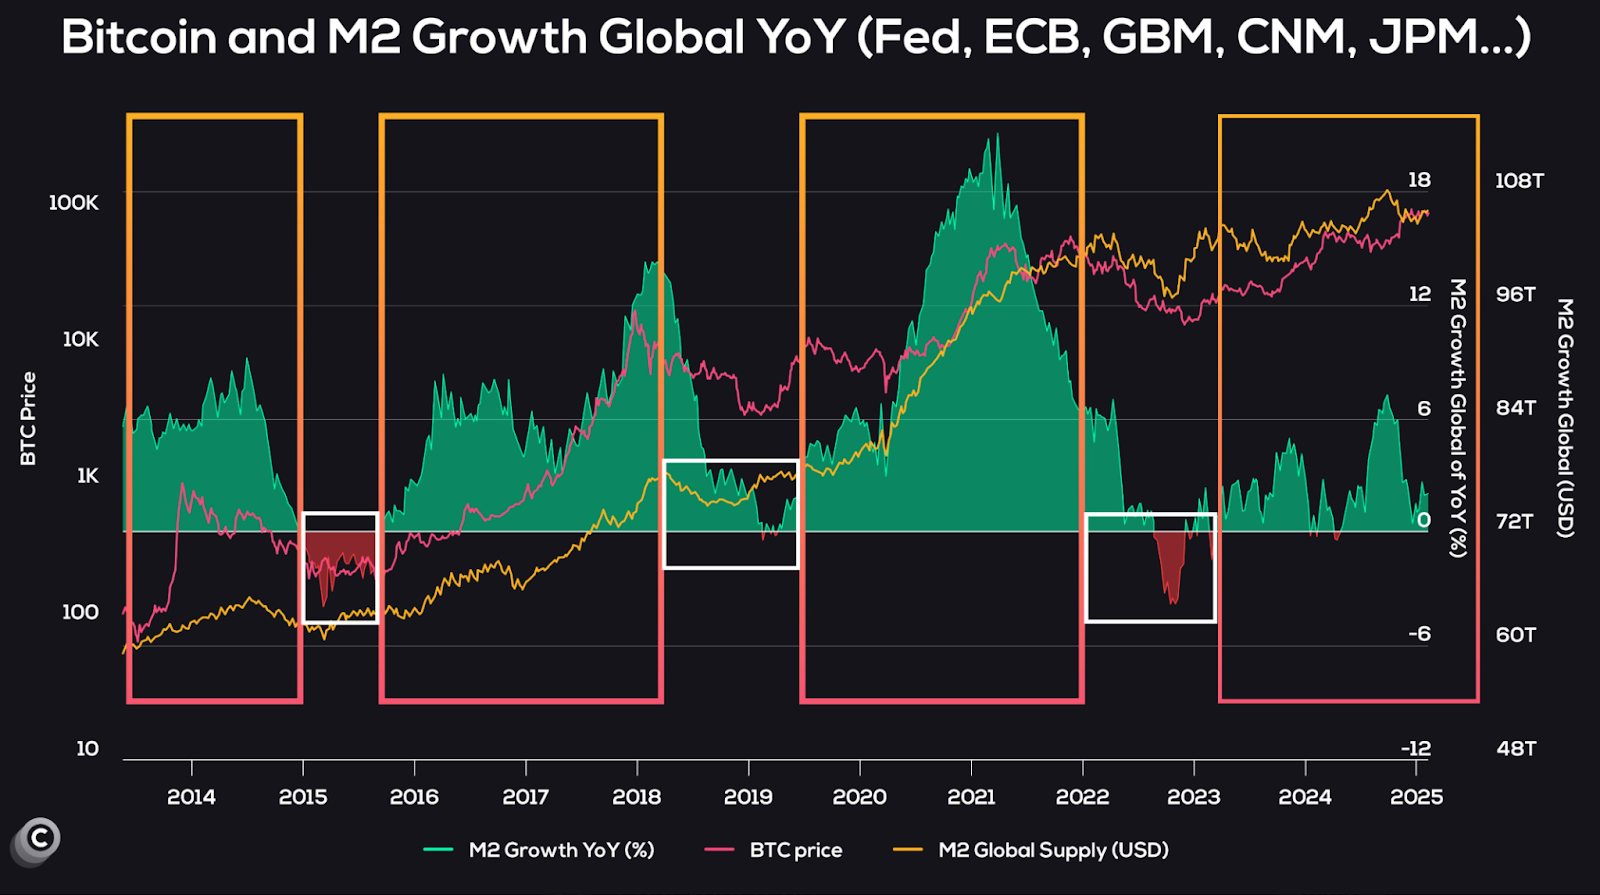
Global liquidity began growing again as of early 2025. After a period of contraction in 2022 and 2023, M2 growth year over year is becoming positive.
Previous bull runs in 2016–2017 and 2020–2021 have seen Bitcoin’s price climb during these expansion periods, as the previous bull runs also followed similar liquidity growth.
Four clear macro cycles are also seen on the chart. They all start during or just following a spike in global M2 growth. The current increase in liquidity hints that another such cycle is underway. If M2 keeps rising, Bitcoin could continue its run higher, provided it holds above the critical $87,500 support zone.