The US stock market witnessed a remarkable upswing on Thursday, March 8th 2024, with major indices closing higher, setting new records. The Dow Jones Industrial Average recorded a gain of 130.30 points, or 0.34%, concluding the day at 38,791.35.
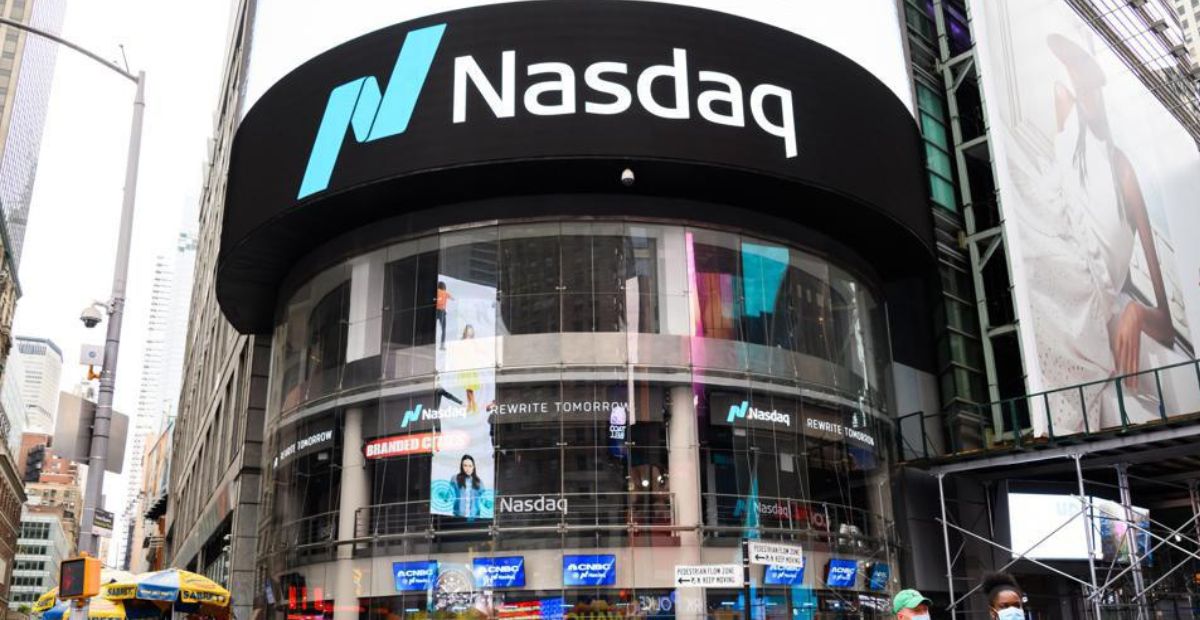
The S&P 500 also exhibited a robust performance, rallying by 52.60 points, or 1.03%, reaching a record high of 5,157.36. The Nasdaq Composite, not to be outdone, achieved an intraday record high and closed 241.83 points, or 1.51%, higher at 16,273.38.
These impressive gains underscore a buoyant market, characterized by a surge in investor confidence and optimism. This surge in stock prices signifies a positive shift in market dynamics, with various factors contributing to the upward trajectory.
Why the Surge?
The driving force behind this market surge lies in the remarks made by Federal Reserve Chair Jerome Powell during his testimony before a US Senate committee.
Powell conveyed that the central bank is on the verge of being confident that inflation is moving toward the 2% target, making the possibility of rate cuts more plausible.
This insight, reported by Reuters, has injected a renewed sense of optimism into the market, as investors interpret it as a signal for potential rate cuts shortly, possibly as early as June.

The impact of Powell’s statements on market sentiment cannot be overstated. Powell’s reassurance that the Federal Reserve is closely monitoring inflation and is prepared to act with rate cuts has resonated positively among investors.
The anticipation of these rate cuts has not only boosted market confidence but has also acted as a catalyst for the impressive gains witnessed in the days following Powell’s Congressional testimonies.
When Did This Happen?
The market surge unfolded on Thursday, a day following Powell’s appearances before the US House Financial Services Committee, which commenced on Wednesday.
Powell’s optimistic outlook on the decline of inflation and the potential for rate cuts aligned with investor expectations.
The timing of this surge, in the aftermath of Powell’s testimonies, highlights the immediate and profound impact that central bank communications can have on market dynamics.
Powell’s appearances before Congress served as a pivotal moment for the market, influencing trading decisions and shaping investor sentiment. The significance of these events in influencing the timing and nature of market movements cannot be understated.
What Sectors Drove the Rally & Which Companies Stood Out?
A crucial driver behind the market rally was the remarkable surge in chip companies, propelling the Philadelphia Semiconductor index to a record closing high, surging by 3.36%.

Among the S&P 500 sectors, Technology emerged as the top performer with a gain of 1.89%, closely followed by communications services, which experienced a 1.84% increase.
Individual stock performances during the surge exhibited a diverse range of outcomes. Meta shares, for instance, witnessed a jump of 3.2%, reflecting positive sentiment surrounding the company.
In the same way, Nvidia, a key player in the tech sector, saw its stock price surge by an impressive 4.5%. These individual success stories underscore the influence of specific companies on the overall market performance.
However, Victoria’s Secret & Co. shares experienced a sharp decline of 29.7%, raising questions about the challenges faced by certain companies in the current economic landscape.
On the other hand, Kroger Co. shares rallied impressively by 9.8%, demonstrating the resilience and adaptability of certain sectors amid market fluctuations.
How Did Other Indicators Fare?
On the Nasdaq, the market breadth was evident, with 2,592 stocks rising and 1,670 falling, indicating a favourable ratio of advancing issues to decliners.
Data from the Labor Department, as reported by Reuters, indicated that the number of Americans filing new claims for unemployment benefits remained unchanged.

Further insights into the job market were provided through private payrolls, job openings, quit rates, and unemployment claims data. Collectively, these indicators painted a picture of a job market that, while showing signs of softening, remains fundamentally solid.
On US exchanges, 11.19 billion shares changed hands during the surge, slightly below the 12.06 billion moving average for the last 20 sessions. This information sheds light on the level of market participation and the intensity of trading during this bullish phase.
The slightly lower trading volume, while still substantial, prompts further exploration into investor behaviour and the factors influencing trading activity.
Any Insights into Market Activity?
The fact that 11.19 billion shares were traded on US exchanges, while slightly below the 12.06 billion moving average, still represents a significant level of market participation.
The economic indicators, such as unemployment claims and private payrolls, offer additional layers of insight into the broader economic landscape.
The unchanged number of Americans filing new claims for unemployment benefits, as reported by the Labor Department, reflects a labour market that is changing but remains steady.
This detailed analysis provides investors, analysts, and stakeholders with a thorough overview of the conditions that led to the surge and the intricate interplay of factors influencing market dynamics.
