
Highlights:
- BTC futures dominance surged, with long positions outpacing shorts by a wide margin.
- Realized cap hits all-time high, showing long-term holders are adding to positions.
- MVRV Z-Score remains low despite price nearing $100K, indicating no major top yet.
The bullish pressure in the futures market is building as Bitcoin approaches $100K, while the realized cap hits new highs.
Meanwhile, the MVRV Z Score remains low, implying there’s still room for further growth and confidence of long-term and short-term holders.
Futures Data Signals Bullish Strength
According to Bitcoin futures data, the buyers are now in control of the market. As CryptoQuant’s Futures Position Dominance v2.0 chart shows, long positions are on the rise.
On the chart, the cluster of green arrows reflected long build-up activity between May 6 and May 8. This means that there were aggressive buyers in the market.
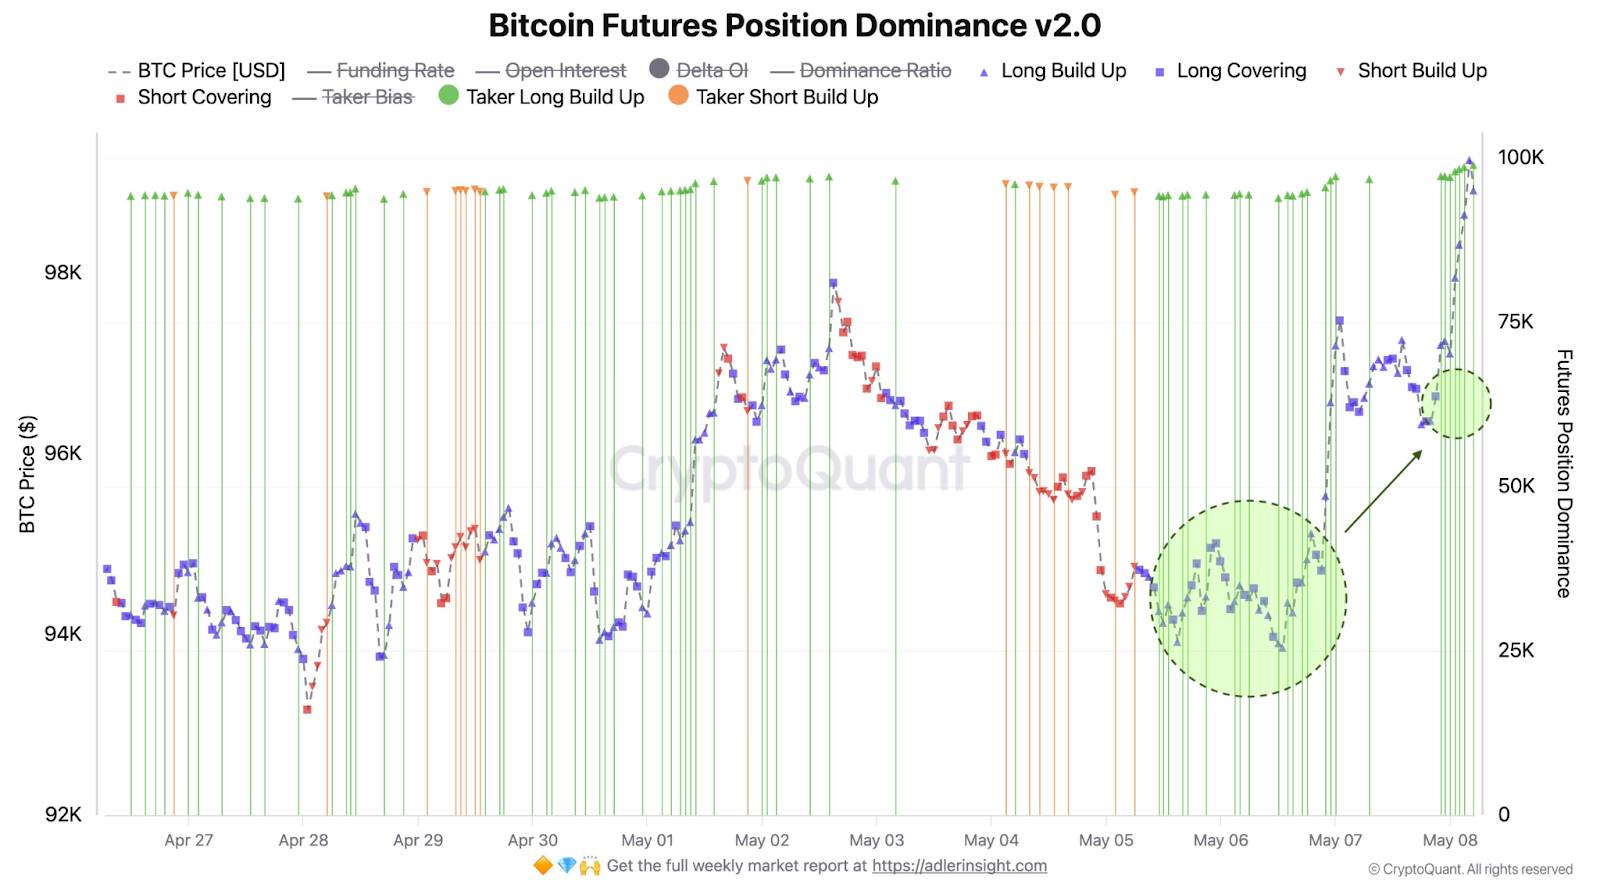
Futures dominance also grew from roughly 25,000 BTC contracts to close to 75,000 BTC by May 8. With a rising price, this large increase in futures activity was bullish.
Long covering also rose, and short positions fell sharply. This indicates that sellers were closing out their positions as price pressure pushed higher.
Two important accumulation zones are highlighted on the chart with green circles. The first zone was around May 6, when the price consolidated and volume went up.
The second zone saw dominance of futures after a breakout above $96,000. All these signs suggest that the market has confidence in Bitcoin and it’s moving towards $100,000.
Market Capitalization Breaks New Ground
Additionally, Bitcoin’s realized capitalization hit an all-time high. By May 7, 2025, the realized cap was $890.74 Billion.
This is a metric that shows the value of all BTC based on the price at which the last coin moved. It shows long-term holder behaviour and conviction by investors.
On the same day, Bitcoin’s market price was $97,025.15. The fact that the cap is rising along with the price indicates that the long-term and short-term holders are confident. According to CryptoQuant, this has happened for three straight weeks.
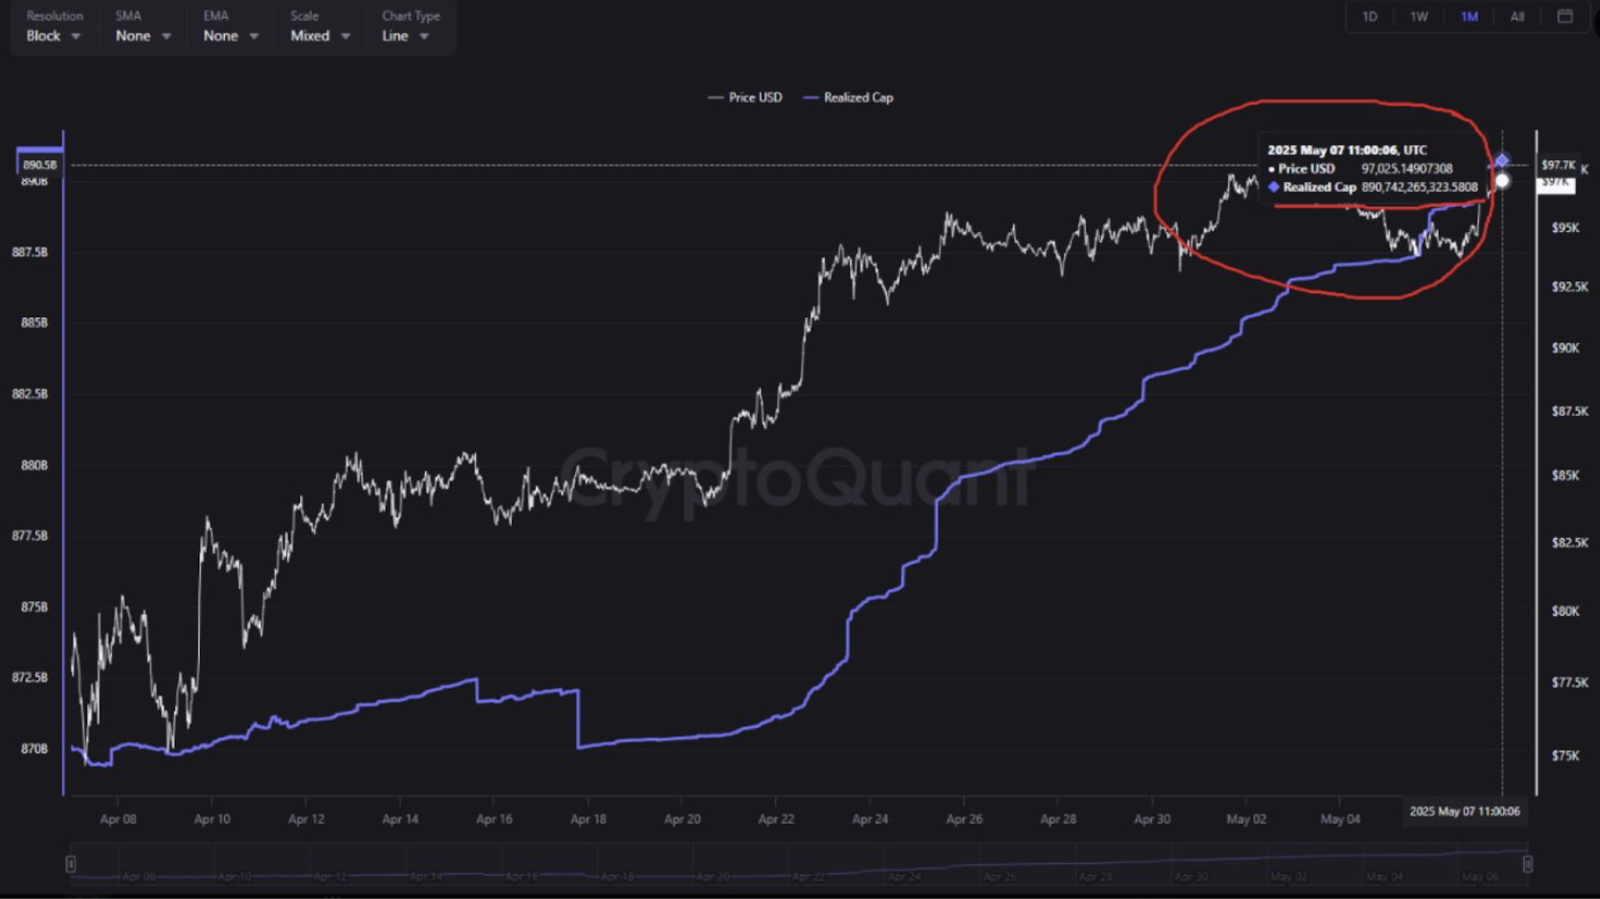
Broad accumulation often accompanies this continuous rise in realized cap. More coins are being held at higher prices.
That means investors aren’t rushing to sell, even near the all-time highs. This bolsters the bullish argument for Bitcoin’s short-term direction.
Additionally, Bitcoin’s MVRV Z-Score, a popular indicator, compares market value to realized value based on historical data to find overbought or underbought levels.
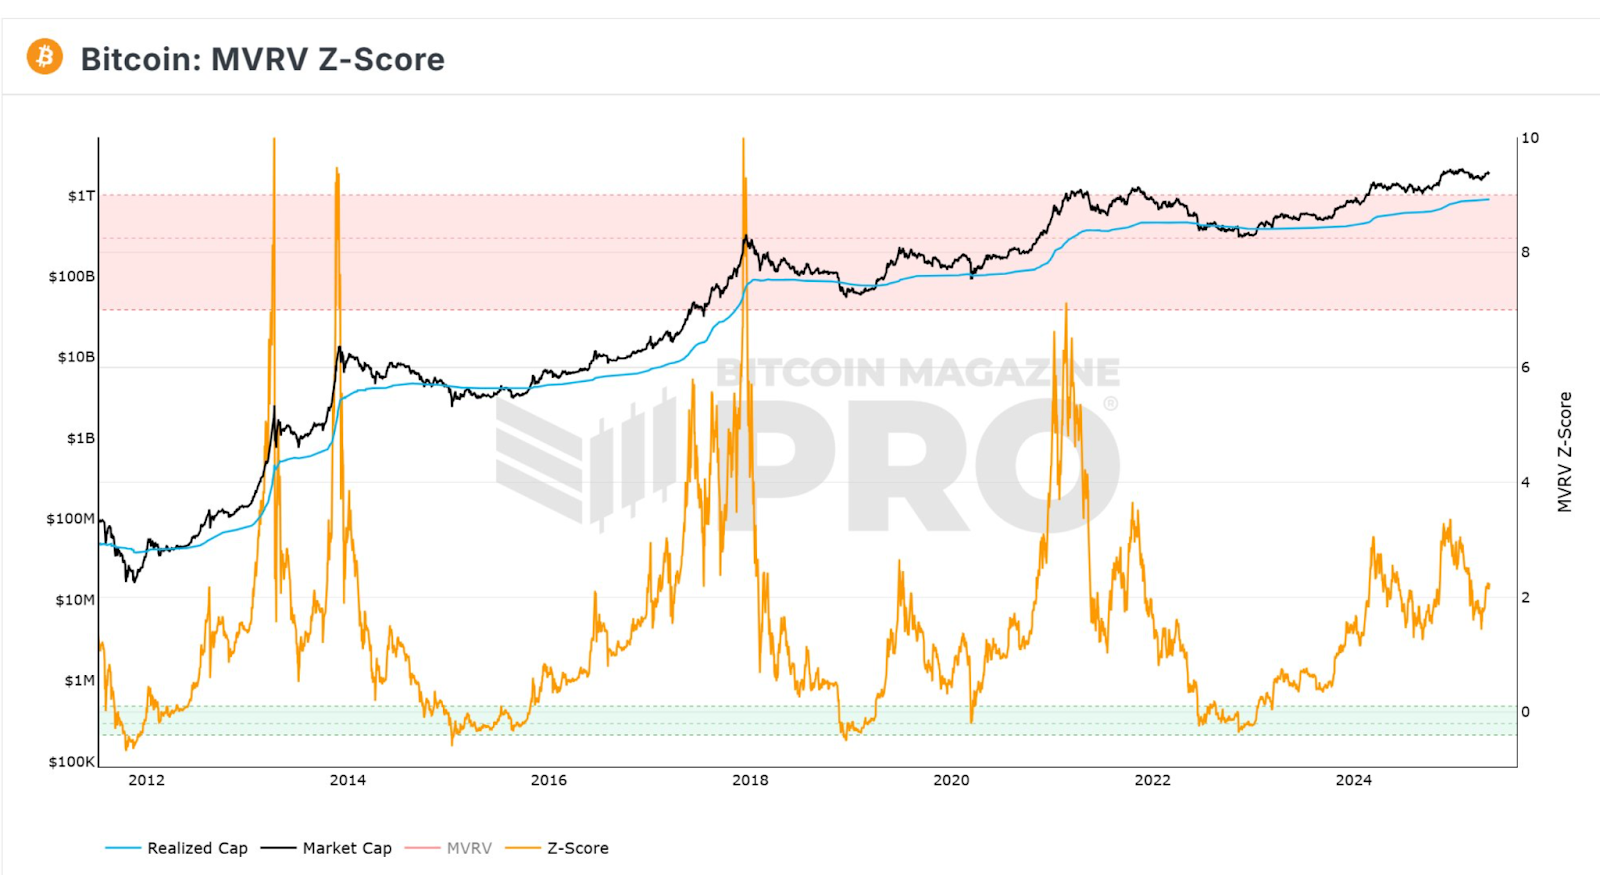
At the time of writing, early May 2025, the MVRV Z Score is just above 2. Major tops in previous market cycles have occurred when the score was above 7.
In other words, the market is not yet in the overvalued zone. Even though Bitcoin is close to $100,000, this metric indicates that there could be more room for price growth.
Technical Breakout Confirms Uptrend
The strength of the breakout is also confirmed by technical analysis. The Ichimoku Cloud analysis shows that BTC has broken above a tight range between $92,880 and $95,800. Now, price is testing $99,577, which is marked as the “level to watch.”
The clean breakout was backed up by strong candle formations above the red baseline (Tenkan-sen) and blue line (Kijun-sen).
These are part of the Ichimoku system and indicate trend direction. The cloud breakout was above the cloud, indicating a bullish trend.
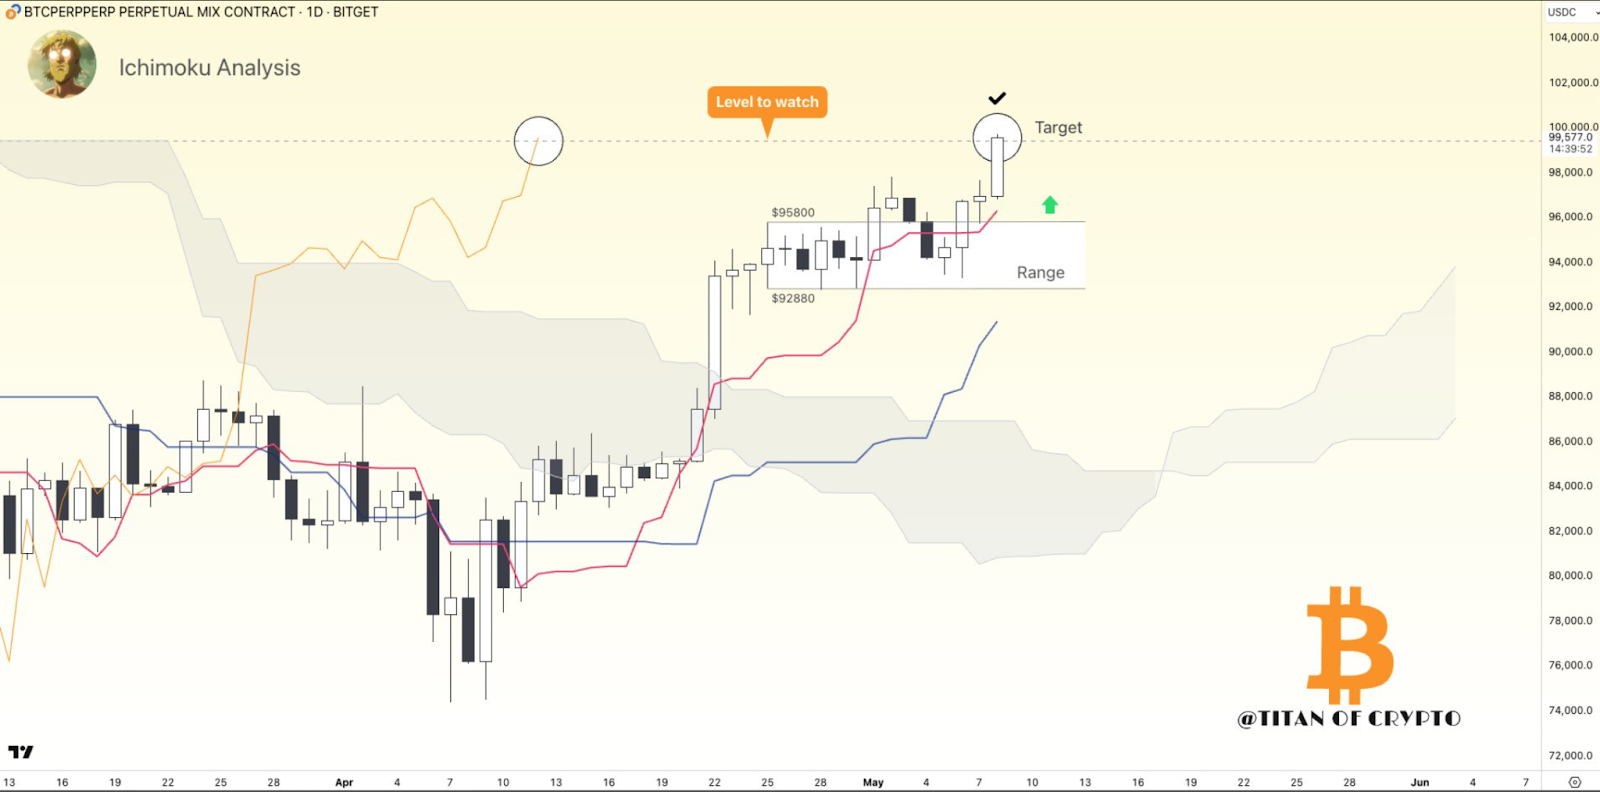
Price targets above $100,000 are shown on the chart, as the cloud projects higher support levels. With the cloud thick and rising, support is strong even if the price dips.
The recent breakout is in line with what the futures data and valuation models are already saying. Sellers are out of the way, and bulls are in charge.
Now, price action, investor behaviour, and market structure were pointing to the $100,000 level as the next key target.