
Key Insights:
- Chainlink is trading near the $13.20 level, where technical indicators suggest a possible accumulation phase.
- The RSI on multiple timeframes is forming higher lows while price makes lower lows, indicating a bullish divergence.
- Analysts note that buying pressure is gradually increasing despite the broader market showing weak sentiment.
Chainlink price prediction currently focuses on the $13.20 level, where technical signals indicate a potential accumulation phase in progress. Despite recent weakness, momentum indicators across various timeframes show early signs of positive divergence. Traders are assessing if these signals mark a possible shift in market dynamics.
Chainlink Forms Bullish Divergence on RSI
Chainlink is showing four consecutive lower lows on price, while RSI forms four higher lows, indicating a bullish divergence setup. The deviation can be observed on the 4-hour timeframe, with stable horizontal support at around 13.20 dollars. This technical structure implies that although prices are still falling, there is a growing trend of purchase interest.
The Relative Strength Index (RSI) currently stands near 38.11 and trends upward, even as Chainlink’s price tests lower levels. Such an RSI drift indicates deteriorating bearish momentum. The trend suggests a weakening sellers ‘ market with cheaper price prints.
The technical analysis indicates that even though a breakout has not been witnessed, the RSI and the support level indicate less downside stress. Clues indicate that long-term traders are watching to see whether volume and sentiment will follow these early technical indicators. In case of confirmation, a close above the recent highs might help to justify the shift to bullish short-term price action.
Analyst CryptoCracker pointed out this trend as Bullish Divergence X4 and noted the steady buyer defense of the current support. His estimate of a possible reversal phase is backed by the strength of the RSI. Confirmation through a decisive breakout remains essential for validating this trend reversal in Chainlink price prediction.
Chainlink Utility Grows Despite Price Stagnation
Chainlink’s adoption of the decentralized oracle network (DON) continues to rise, though the token price remains suppressed at nearly $13.20. Despite weak price action, Total Value Secured (TVS) by Chainlink has reached new all-time highs. Such a discrepancy between utility and valuation is becoming an indicator of increasing protocol strength.
Analyst Enclave said the disconnect could indicate temporary inefficiency of pricing and not a deep-seated weakness. As processing activity on-chain grows, valuation based on this activity is likely to overtake real protocol usage in the long term. Current market conditions do not yet price in Chainlink’s expanding utility.
This mismatch between usage metrics and price performance may influence future Chainlink price prediction as the market re-evaluates its metrics. Although speculative interest has cooled, developers continue integrating Chainlink services into decentralized applications. Price confirmation can ultimately change attitudes to utility-based expansion.
The protocol’s dynamics usually need time to impact the price of tokens, and this is more so in a consolidating or correctional market. The continuation of growth in Chainlink’s ecosystem shows confidence among builders and network users. The token’s structural support can be enhanced with time as utilization grows.
Weekly Technical Chart Confirms Neutral Trend Development
The weekly chart shows that Chainlink has remained in a consolidation pattern after failing to hold above $20. The prices have been creating lower highs and lower lows, and the LINK has been close to the level of 13.19. This tendency implies a stagnant market that is not gaining any further momentum or losing it.
The weekly RSI stands at 44.12, which shows neutral to slightly negative momentum. There had been a previous downtrend in divergence, whereby the RSI registered a lower high when a higher high was registered in price.
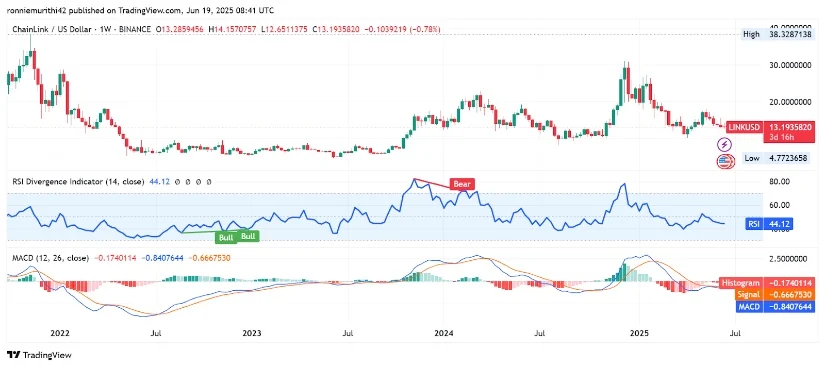
The MACD indicator with the same timeframe indicates that the MACD line is below the signal line, and the histograms are negative. These conditions affirm that there is moderate bearish pressure but not sharp downward momentum. For a stronger bullish Chainlink price prediction, indicators must shift toward confirming upward momentum.
Chainlink’s support of nearly $13.20 remains at a critical level, reinforced by technical and on-chain signals. This area can be the area of near-term accumulation as traders await directional confirmation.