
Key Insights:
- BTC whale wallets (≥1k BTC) rise to 1,455 as price hits $109K, showing renewed interest from large holders.
- Coinbase Premium Index turns positive, signaling stronger U.S. demand and institutional buying activity.
- OTC balances fall from 486K BTC to 115K BTC, reducing available supply for off-exchange institutional purchases.
Large holders are increasing their balances again, and U.S.-based demand is showing strong signs of growth. The number of whale wallets with at least 1,000 BTC has hit a week’s high.
Coinbase’s Premium Index, which measures buying interest from U.S. investors, has also turned positive at the same time.
Whale Wallet Growth and Rising Profit Margins Point to Strong Market Conditions
Over recent weeks, the number of Bitcoin wallets holding 1,000 BTC or more has been increasing steadily. According to Glassnode data, the count of these large wallets fell slightly in late April before rising again to 1,455 entities by the end of May.
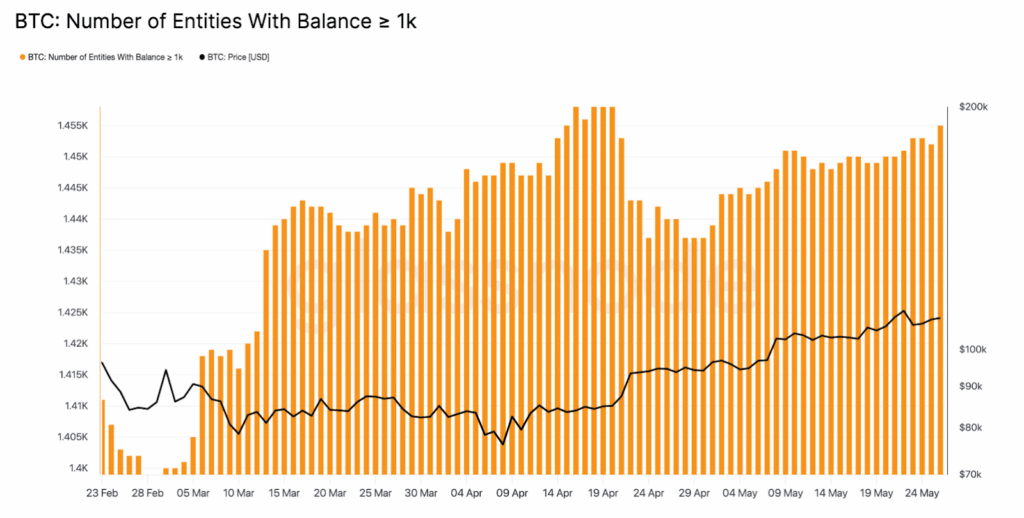
The rise came as Bitcoin’s price hit a new all-time high, climbing above $109,000. The whale wallet count remained between 1,420 and 1,445 from mid-March to early May, but the current growth indicates new accumulation by large holders.
These wallets are often linked to institutions or long-term investors, so the upward trend is probably more due to strategic buying than short-term speculation.
Traders are, at the same time, recording higher average profits. On-chain data shows that the current average profit margin for Bitcoin holders is 27%.
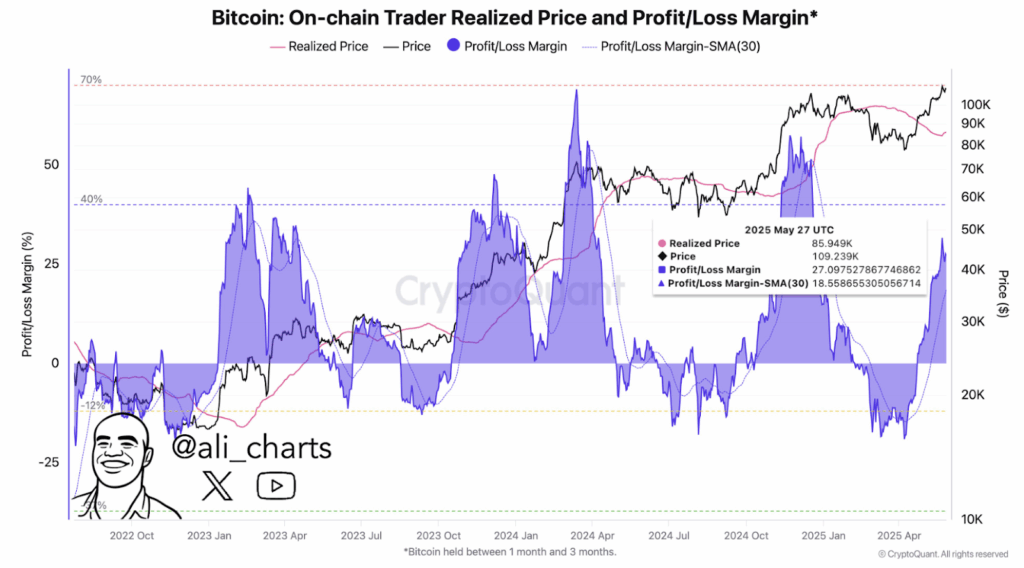
While this is well above break-even, it is below the 40% level that, in past cycles, has been a point at which many start to sell. Bitcoin trades at around $109,239, but the realized price or the average cost at which coins last changed hands, is now about $85,949.
Since the margin has not yet hit the area where tops are commonly formed, there is still potential for more upside, provided that the current buying continues and no major sell-offs take place.
Coinbase Premium Signals U.S. Buyer Strength
The Coinbase Premium Index went positive again during Bitcoin’s latest rally. This index is the price difference between Coinbase and other major global exchanges like Binance. If Bitcoin is trading at a higher price on Coinbase, it means that U.S.-based investors are demanding to buy it.
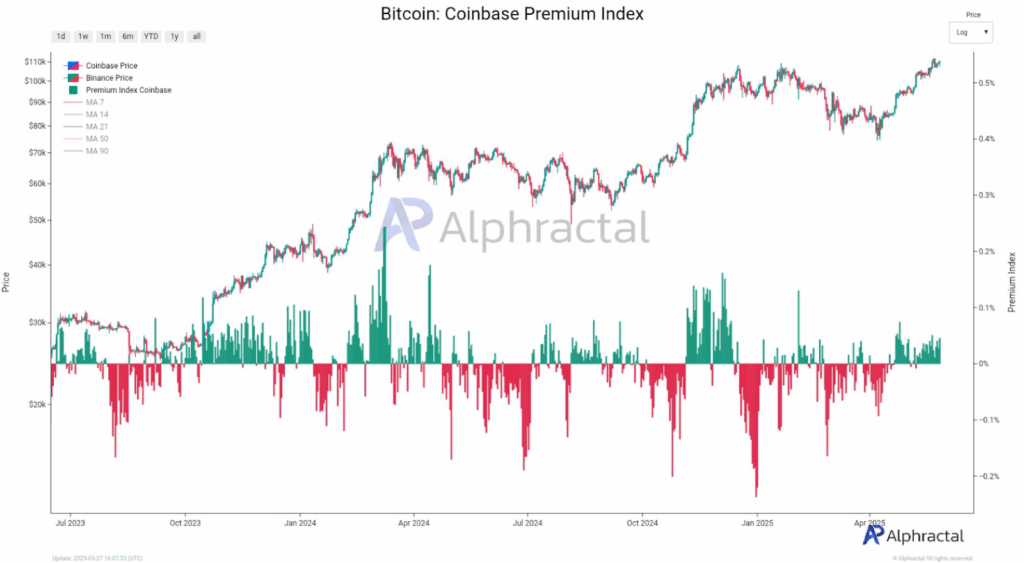
In the past few months, the premium index has been mostly negative or neutral. But it went positive during the May price rally.
The change also indicates a renewed interest of U.S. institutional buyers, which historically has added strength to upward trends. When capital inflows from the U.S. rise, the premium on Coinbase is usually a result of more trading volume and stronger spot market support.
OTC Supply Decline Points to Tightening Supply
The available supply for off-exchange trading has continued to fall as over the counter (OTC) desk Bitcoin balances have continued to fall. CryptoQuant data shows OTC balances have fallen from 486,000 BTC in September 2021 to 115,400 BTC by May 2025. This is over 4 times lower than the supply over 3.5 years.

As the chart shows, OTC balances have been steadily declining, with an acceleration of late. At the current rate of withdrawals of about 276 BTC per day, the remaining balance could be exhausted by July 2026.
The more coins that get sold in private sales, the less available are left for the open market which becomes more important for price movement. If demand keeps going up, but supply remains limited, this could help support higher prices.
Long-Term Trend Structure Suggests Fresh Breakout
In a chart using monthly OTT bands (a trend following tool), Bitcoin just broke out of its retest range. In previous cycles, this pattern has shown up, including in 2016 and 2020, before major bull runs started.
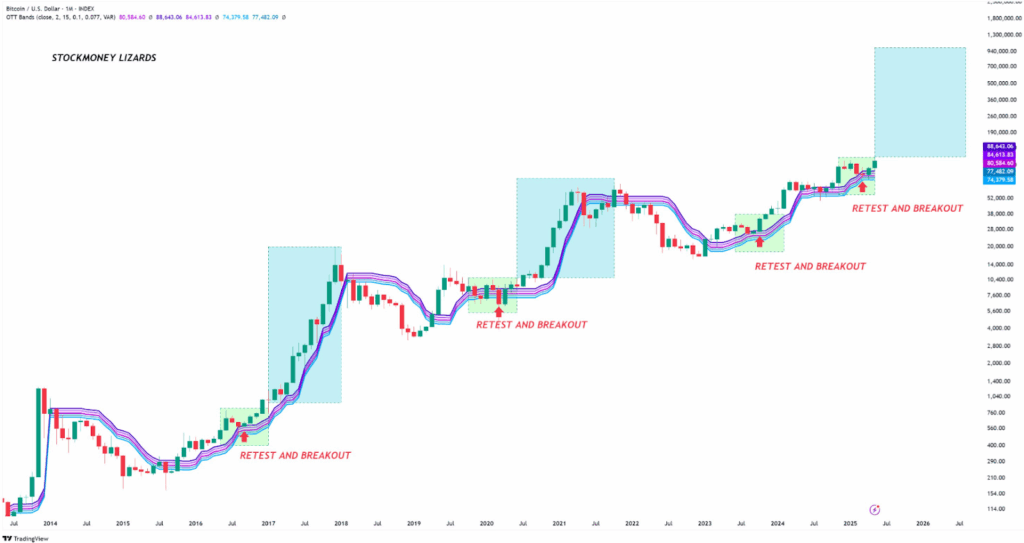
Bitcoin has repeated this pattern, according to current readings, after testing the trend line earlier this year. Large moves followed past breakouts, including the rally to $20,000 in 2017 and the surge to $69,000 last year.
If the pattern continues, it may be the early days of a longer uptrend, but that depends on demand remaining strong and supply tight.