Key Insights:
- Metaplanet stock could crash 25% if it fails to hold $1,400 level.
- Metaplanet now owns 11,111 BTC worth ~$1.07B, ranking among the top 10 corporate Bitcoin holders globally.
Over the past week, the Japanese publicly listed company Metaplanet Stock (3350), known for its Bitcoin (BTC) strategy, has plummeted over 27% and is now making waves in the cryptocurrency space. With its continued decline, Metaplanet has reached a make-or-break situation.
Why is Metaplanet Stock Price Falling?
This price drop began following Metaplanet’s issuance of 54 million company shares to expand its Bitcoin holdings. The new shares were issue with the help of institutional investor EVO Fund, valued at 74.9 billion yen, equivalent to $515 million.
Japanese Bitcoin Holding Firm Metaplanet Strategy
With its Bitcoin strategy, the company aims to become the largest corporate Bitcoin holder in Asia. Additionally, the firm plans to hold 1% of the total Bitcoin supply by the end of 2027.
Before achieving this substantial BTC goal, the company recently shared a blueprint outlining its quarterly and annual Bitcoin acquisition targets through 2027. According to the data, Metaplanet plans to acquire nearly 30,000 BTC by FY25, 100,000 BTC by FY26, and 210,000 BTC by FY27.

Metaplanet stock, with its strategic Bitcoin acquisitions, now holds 11,111 BTC worth nearly $1.07 billion and currently ranks among the top 10 corporate BTC holders in the world.
Looking at Metaplanet’s Bitcoin strategy, it appears to be following in the footsteps of Michael Saylor’s approach — raising funds through stock offerings to purchase Bitcoin.
However, the Bitcoin accumulation strategy began when the price of Bitcoin (BTC) was below $20,000, and it is now one of the most profitable crypto-focused firms in the United States.
Stock Performance and Current Momentum
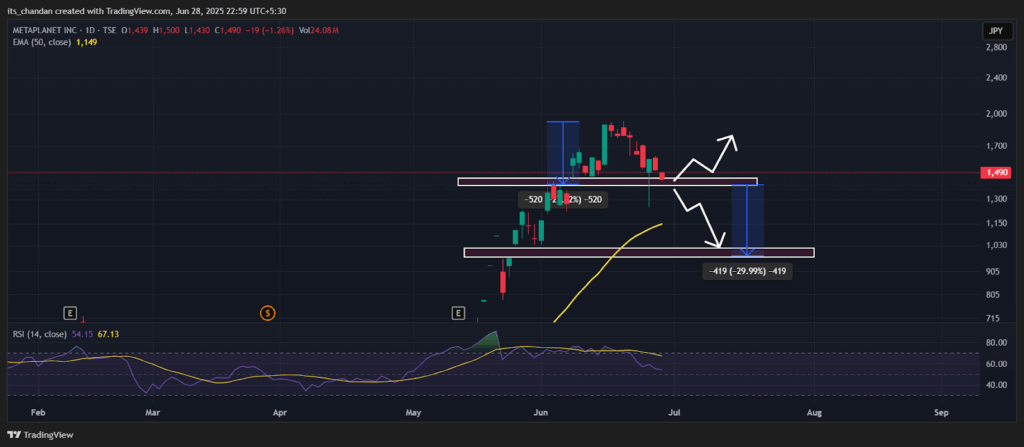
Besides all this, Metaplanet stock is trading near $1,490 and has recorded a price drop of 1.26% today. Over the past week, the firm has registered a decline of 10.30%.

Despite the notable price drop in the past week, Metaplanet shareholders have made substantial profits over the past year. Data from Google Finance reveals that Metaplanet stock has surged by an impressive 1,390% over the past year—far outperforming many financial giants across the world.

Metaplanet Stock Price Action and Key Technical Analysis
According to expert technical analysis, Metaplanet stock appears bearish and is poised for significant downside momentum in the coming days.
As per the daily chart, the asset has successfully formed a bearish head and shoulders pattern and is on the verge of a breakdown.

Metaplanet Price Prediction
Based on recent price action and historical patterns, if the asset breaches the neckline of the head and shoulders pattern and closes a daily candle below the $1,400 mark, it could pave the way for further downside momentum.
If this happens, there is a strong possibility that the asset could experience a price drop of over 25%, potentially reaching the $1,050 level in the near future.
On the other hand, if sentiment shifts and Metaplanet stock holds above the $1,400 level, it could gain upside momentum. If not, the price may enter a consolidation phase.
At press time, Metaplanet’s Relative Strength Index (RSI) stands at 54, indicating that the asset is still near oversold territory and may see a price reversal if sentiment shifts.
