
Key Insights:
- Peter Schiff claims the U.S. will suffer most when the crypto bubble bursts.
- The Bitcoin Bubble Index shows historical cycles of speculative inflations and crashes.
- Current BTC price trends near highs while bubble indicators begin to rise again.
Not so long ago, economist Peter Schiff warned against Bitcoin, cautioning that a crypto bubble might soon burst. He stated that the consequences to the United States might be the most severe ones.
Schiff’s remarks follow a surge of concerns regarding the overvaluation of the cryptocurrency market, as evidenced in past indicators that point to a frequent occurrence of speculative activity.
In a podcast, Schiff claimed that the U.S. is most vulnerable to this possible fallout since it also has the biggest cryptocurrency lobby.
He claimed that Americans have the lion’s share of this bubble, so a bust in the crypto markets will be disproportionately higher than in other countries.
Schiff Rejects Strategic Bitcoin Reserve Idea
Others have also critiqued Schiff for persisting in the argument that the U.S. should create a Strategic Bitcoin Reserve. Advocates believe this action will cause governments to rush to possess the digital asset, but Schiff does not support this idea.
He stressed caution in the belief that other countries would follow the American example, describing the tactics as ill-informed and guessing.
Analyzing the long-term data trends presented in the Bitcoin Bubble Index chart, we see that the green slope in the graph, which is the indicator of the Bitcoin Bubble Index, has revealed a series of sharp rises and equally high falls. It is important to note that two prestigious summits took place in the closing quarter of 2017 and the 2021 cycle, which well corresponded with the historical prices of BTC’s all-time highs.
Such spikes were accompanied by record entry of retail investments, excessive volume in social media conversations, and difficulty in mining, common traits of a speculative bubble. The information also demonstrates that after those highs, corrections were characterized by major drops in market value and people’s interests.
Recent Bitcoin Metrics Reflect Elevated Market Activity
Bitcoin is now trading over $106,000, and it is getting near all-time highs. As indicated in the chart, this price increase is accompanied by an increase in the number of transactions, address activity, and general difficulty. Although the yellow line represents the BTC price going up, the green index of the bubble paradigm provides an impression of a not-so-volatile sentiment, as it was during the last cycle, at least currently.
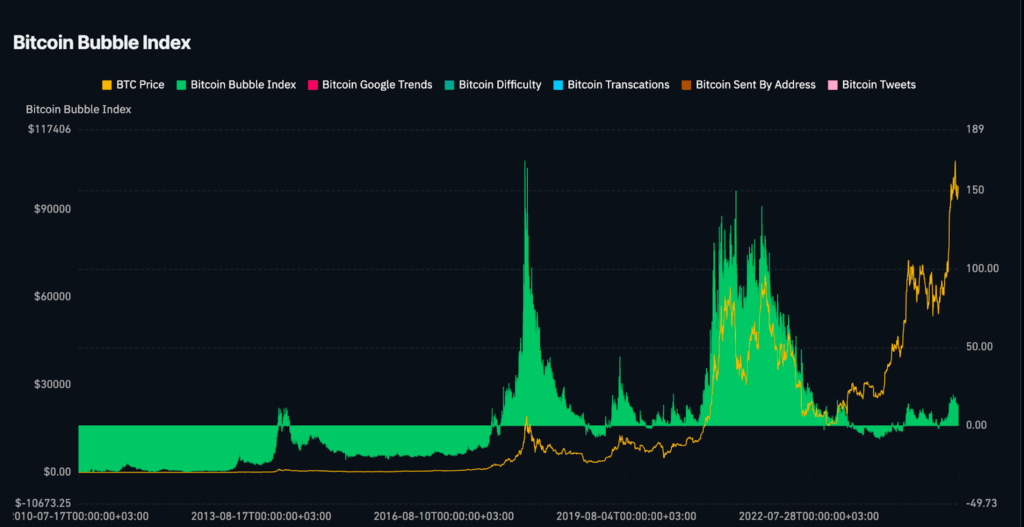
But the steady increase in the warning signs of bubbles and a past record of sudden backfires give some validity to Schiff’s warning. The possibility of a crypto bubble seems real now, and the statistics graphically display the cyclical growth and decrease of the past ten years.
The overall altcoin market advises elevated speculative behaviour. The last daily visualization of the crypto bubble revealed strong increases in the market in many assets. The bubble chart demonstrates good returns by projects such as JTO (13.6%), SKY (7.2%), HYPE (7.1%), and MKR (7.4%). SOL and FET likewise show increases of more than 6 percent.
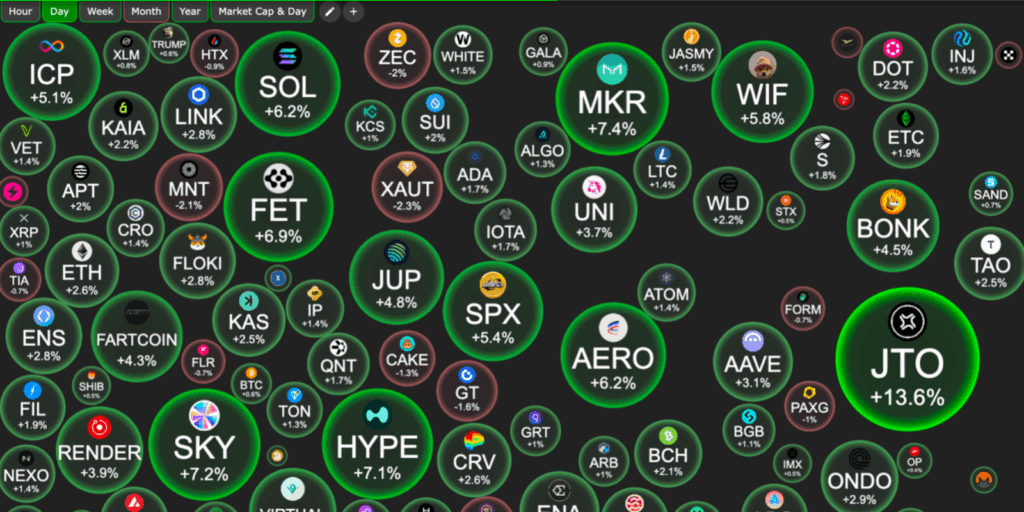
Such allocation of growth to speculative tokens and meme projects is also indicative of a renewed risk-seeking mood on the market. These situations resemble the latter phases of a bubble cycle during which participants in the retail market rush into the holdings of smaller-caps seeking huge returns.
Even though sentiment metrics and price action do not provide a fixed tipping point, the combination of the two metrics has created a concern that a crypto bubble might be at a late stage.