
Key Insights
- Dogecoin price prediction 2025 points to $0.31 after a confirmed pennant breakout.
- RSI on the daily chart is bouncing off a key ascending support line, historically triggering major DOGE price rallies.
- DOGE derivatives show a 55% surge in volume and a 3.7 long/short ratio among top Binance traders. This signaled strong bullish sentiment.
Dogecoin price prediction 2025 gained renewed attention following a confirmed breakout from a bull pennant formation. The breakout above $0.2350, flagged by analyst Ali Martinez, has set the stage for a potential move toward $0.31.
Bull Pennant Breakout Points To $0.31 for Dogecoin Price
Ali Martinez, a crypto analyst, noted that Dogecoin broke out of a bull pennant pattern. Consequently, this indicated that an uptrend may continue after a substantial advance.
A break above the upper resistance occurred on the 1-hour chart at roughly the $0.2350 area. This confirmed that the pennant pattern’s consolidation phase has ended.
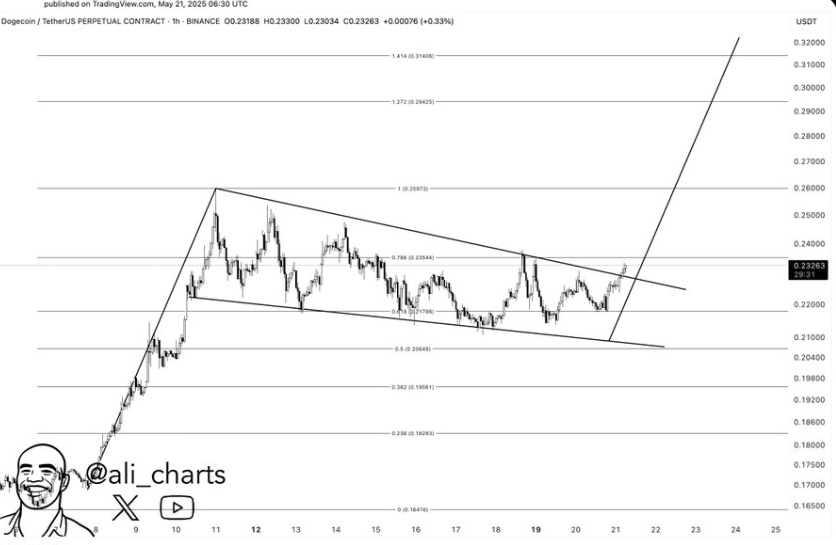
Notably, the height of the previous flagpole is used to decide where the next target should be located. In this case, the measured price level matched the $0.31 price. This forecast is supported by Fibonacci extension levels.
The two Fibonacci targets are near $0.2670 and $0.3146, straight lines on the chart. Increased volume during the breakout gave the pattern credibility.
RSI Support Line Adds Weight to Dogecoin Price Prediction 2025
According to Trader Tardigrade’s daily chart analysis, the Relative Strength Index (RSI) is heading towards a trendline. It has commonly led to Dogecoin price rallies in the past.
This level of the RSI has been followed by higher prices in the past. The support line has also been regularly verified, proving its significance as a momentum indicator.
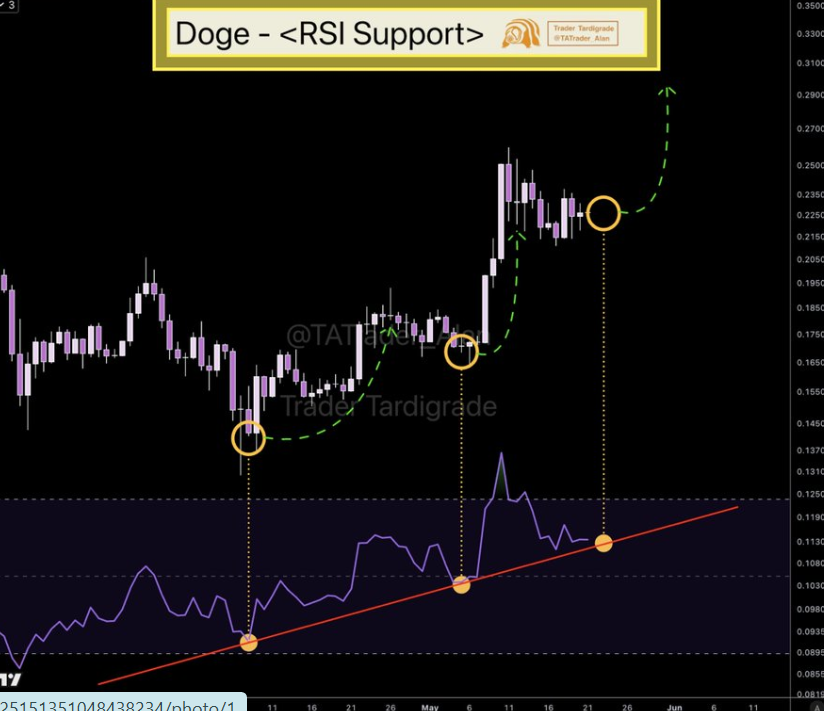
Over the past few months, the RSI has remained above the trendline. At the moment, the RSI has risen to a similar value, happening when the price is around $0.22 to $0.23. If the pattern is repeated, the market might see another increase, as the RSI helps trigger it.
Moreover, Trader Tardigrade pointed out that Dogecoin has formed a cup-with-handle pattern and now suggests a bullish break above $0.24. The chart showed a base followed by a consolidation pattern, ending with a sharp breakout.
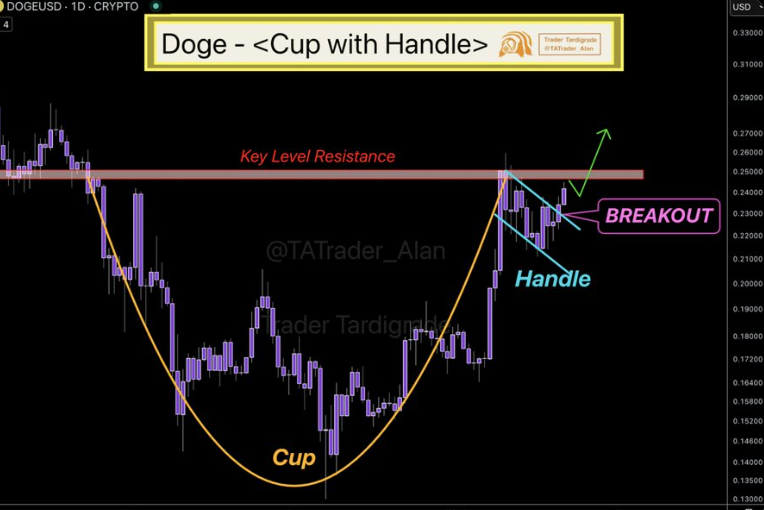
After a breakout, the trend usually resumes, and the breakout zone is now used as support. Should the direction of the meme coin remain upward and hold above the past resistance point, the target is $0.27–$0.30.
Derivatives Metrics Reinforce Bullish Dogecoin Price Prediction 2025
Meanwhile, more than 52% more Open Interest was recorded for DOGE derivatives, reaching $2.90 billion. This suggested more money was getting into the market as traders opened additional positions.
Volume rose by 55% to reach $7.41 billion worth of currency traded each day. These growing numbers show a noticeable increase in market activity after the breakout.
Options data also showed a 194% increase in volume and a 33% rise in open interest, indicating greater speculative activity. Meanwhile, top traders at Binance saw a long/short ratio of 3.717, while regular traders stood at 2.639.
These numbers suggest that the majority of traders anticipate the market to rise. Additionally, Liquidations from the past 24 hours revealed that the number of long and short rekt was almost the same. This indicated equal involvement from traders on both sides of the market.
On the technical indicators, the 4-hour Dogecoin price chart showed that the Stochastic RSI was in overbought conditions. Such elevated readings suggest that upward momentum is strong.
However, it also raises the likelihood of a short-term pullback or consolidation phase if the indicator begins to cross down from these extreme levels.
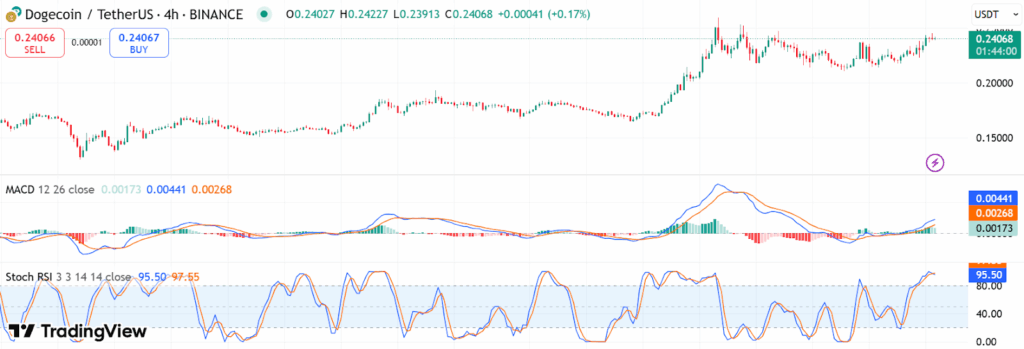
The histogram was positive, suggesting increasing bullish momentum. This setup typically supports further price gains, provided the MACD lines continue to diverge and maintain an upward trajectory.
The MACD on Dogecoin’s 4-hour chart signaled a bullish crossover. The MACD line at 0.00441 is positioned above the signal line at 0.00268.