
Key Insights:
- Ethereum is trading at $1,835 and struggling to break the crucial resistance level near $2,000.
- The token has rebounded 32 percent from its April lows but remains weak compared to Bitcoin and Solana.
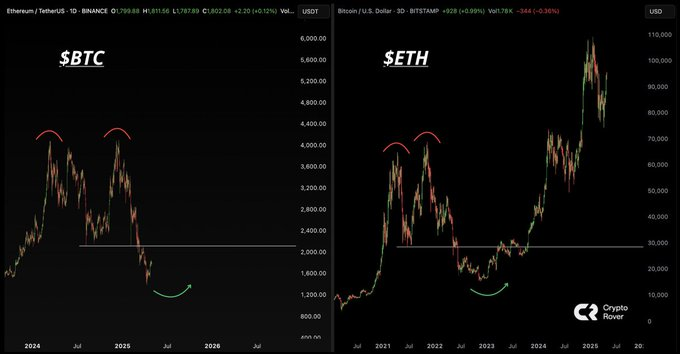
- Analysts see a bullish setup forming on Ethereum’s chart that closely mirrors Bitcoin’s pattern before its major rally.
Ethereum trades at $1,835, fighting to break key resistance near $2,000 after a 32% rebound since April.
Its performance still lags against Bitcoin, having touched 2020 lows, while it posted a historic low versus Solana.
Yet, some analysts see a potential breakout, as Ethereum shows a similar chart pattern to Bitcoin’s pre-rally structure.
Ethereum Price Struggles to Recover as Bearish Sentiment Persists
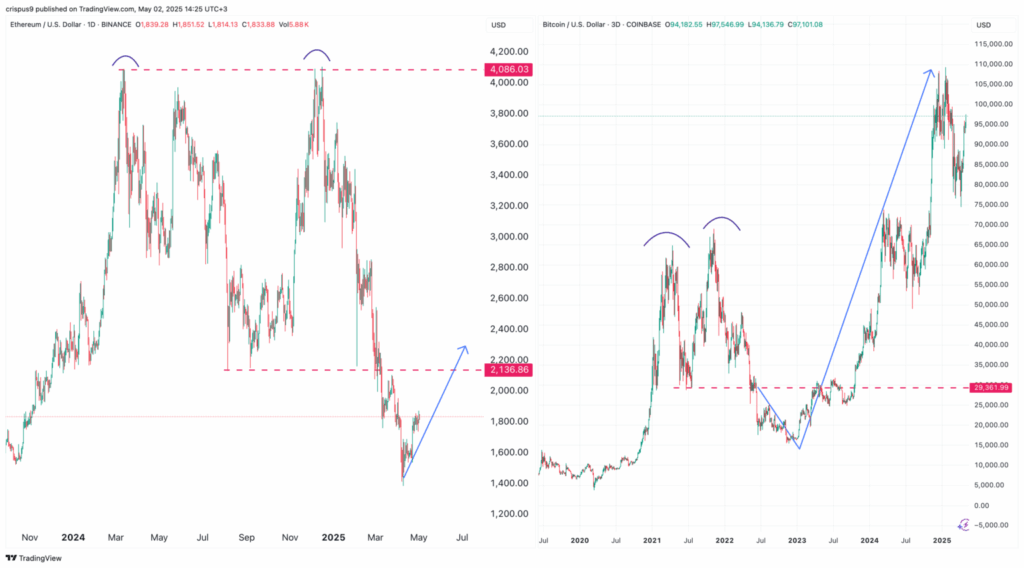
The Ethereum price has failed to rise above its previous support after dipping below $2,135 early this year.
Ethereum experienced peak points at $4,086 while developing a bearish double-top chart pattern.
Following support penetration, Ethereum could not continue its price movement above $2,000 despite brief price rises.
Market analysts suggest that Ethereum demonstrates the same chart pattern that Bitcoin displayed before achieving its record-breaking $109,300 peak.
The pattern of two peaks that Bitcoin displayed turned into a double-top, followed by a price drop until it reached $15,522, then proceeded to break through its neckline at $29,361.
The next price direction for Ethereum seems to be aiming for $4,000 or beyond, following its current trajectory.
Price action above $2,135 would create an optimistic long-term trend for Ethereum as it removes near-term resistance barriers.
The resistance level will likely switch sentiment if confirmation occurs above its threshold, which could draw additional buying interest.
The token shows signs of either stabilizing or declining value, since it has yet to surpass key resistance levels.
Liquidation Trends Reveal Market Pressure on ETH
Data from Coinglass highlights frequent spikes in ETH liquidations, especially during major price moves in recent months.
The notable occurrences that indicated high market instability occurred in early December, late January, and early April.
Market price movements during these events forced traders to liquidate their long and short positions because of unexpected market movements.
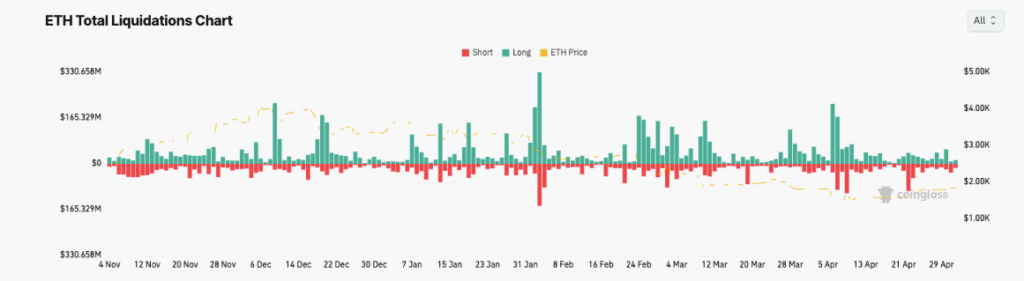
The long period of liquidations on the chart demonstrates that bullish positions have received stronger penalties compared to bearish positions when prices decline.
In late January, Ethereum saw its largest liquidation event, which reflected a sudden drop that liquidated leveraged long traders.
In contrast, short liquidations spiked during mid-February and mid-April, when ETH briefly rallied.
ETH’s price movements between $1,600 and $3,000 over the past six months have contributed to these extreme liquidation events.
The unusually wide price swing affects investors’ trading positions, especially those who employ leverage.
Market unpredictability may cause elevated liquidation activities to persist in any direction, thus influencing price motion.
ETH Chart Mirrors Bitcoin’s Historic Rally
Ethereum’s next move could depend on several external and internal factors influencing this year’s crypto market.
A rebound in Bitcoin’s value could act as a tailwind, supporting a rally across alternative cryptocurrencies, including ETH.
Specialists expect Bitcoin to appreciate substantially, potentially raising its price to $200,000.
On the internal side, Ethereum’s upcoming Fusaka hard fork may provide technical improvements that enhance network utility and boost confidence.
Additionally, Ethereum must regain its market share in sectors such as decentralized exchanges, where it now faces intense competition.
Chains like Solana and Base steadily expand in this area, reducing Ethereum’s dominance.
A shift in the macroeconomic outlook could further support Ethereum’s recovery in the coming months.
The crypto markets would gain strength from positive trade dialogue between the United States and China and any policy changes, including rate cuts.
Ethereum’s chart pattern and technical signals may result in a strong breakout if these factors align.