
Key Insights:
- ETH prints a monthly doji, a pattern seen near major market bottoms.
- Exchange-held ETH drops below 10% for the first time in nine years.
- Market valuation metrics show ETH may be undervalued at current levels.
Both on-chain and technical signals are aligning and flashing early signs of a trend shift on Ethereum.
The monthly chart has formed a long-legged doji, and exchange supply has dropped to a nine-year low, both of which suggest downside pressure may be fading.
Doji Monthly Appears at Historical Bottoms
On its monthly chart, Ethereum has printed a long-legged Doji candlestick. When the open and close prices are very close but the wick (both upper and lower) is long, this is the pattern that is formed.
Trader Tardigrade shared a chart showing that this Doji comes at the lower end of the current market structure after a multi-month downtrend.
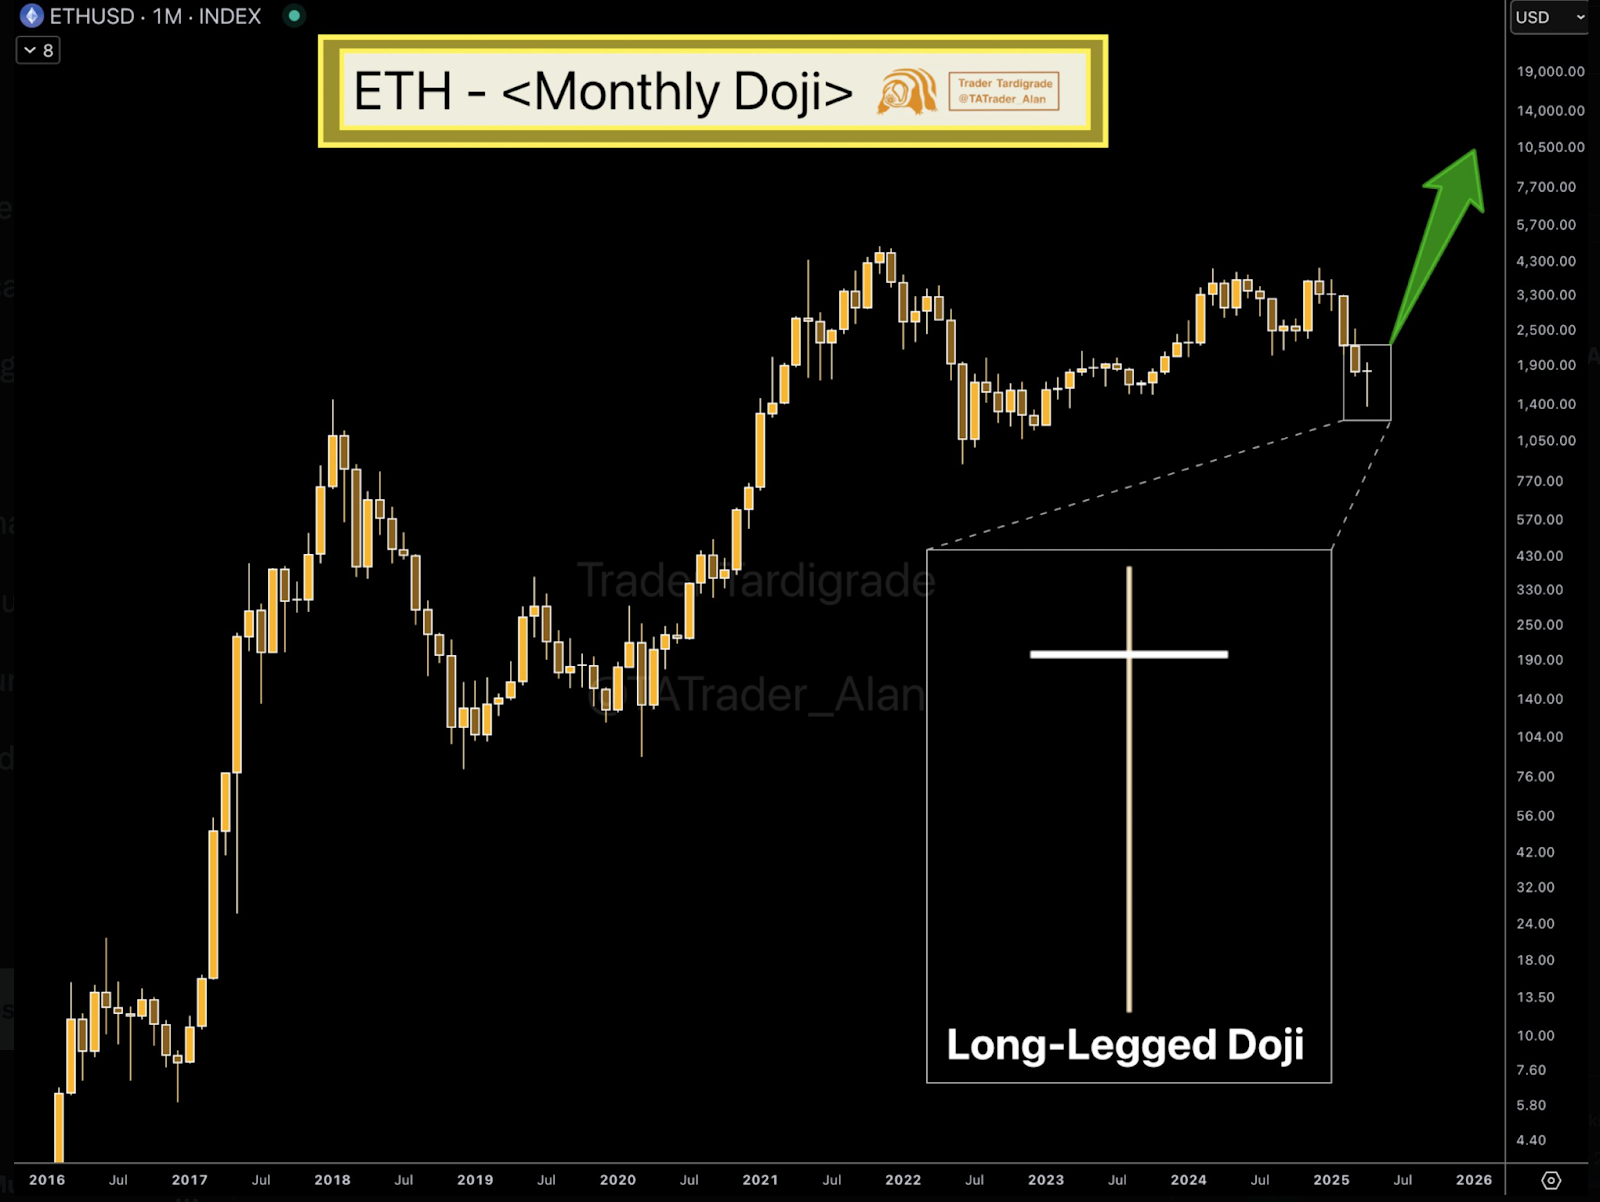
Historically, the same pattern has appeared near price bottoms during Ethereum’s past cycles. This candlestick may indicate indecision or weakening selling pressure when it forms at the end of a downtrend.
At the moment, ETH is trading around $1,800, which is close to the levels where previous reversals started, including in December 2017 and mid-2020.
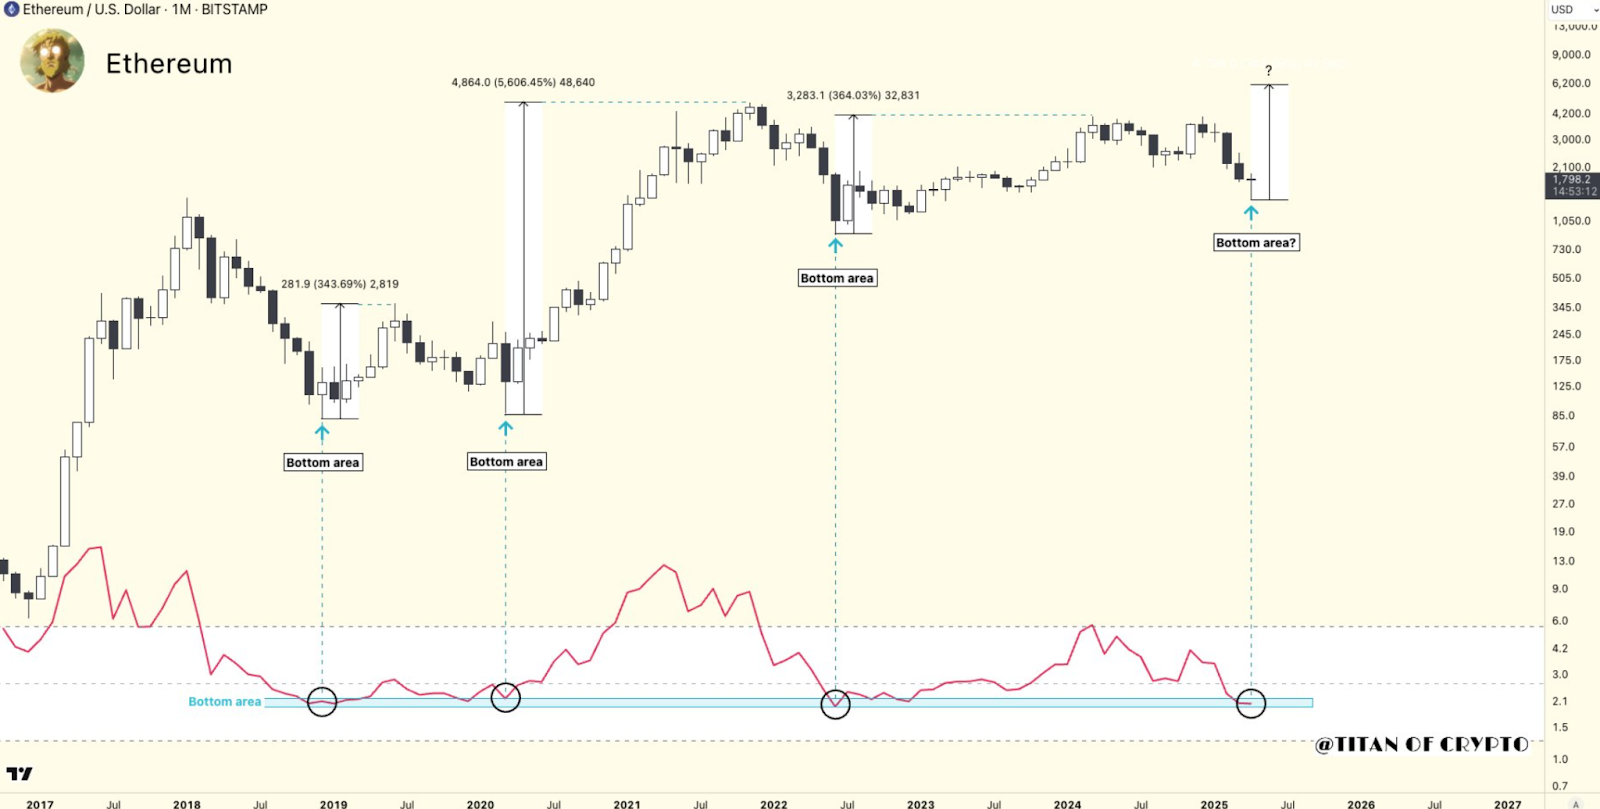
This view is supported by the fact that Titan of Crypto’s chart also shows Ethereum’s monthly RSI hitting a low zone that has historically corresponded with major bottom formations.
Previously, RSI levels below 3.0 have marked the end of Ethereum’s bearish phases and have led to rallies of over 300% in 2019 and 2020.
Supply Drops to Historic Lows on Exchange
Further reinforcing this potential shift, Glassnode on-chain data shows that the percentage of Ethereum held on exchanges has fallen to the lowest point in nine years.
Now, the exchange balance is below 10%, from more than 30% in 2020. Even as Ethereum’s price has been in a broad range for the last year, this trend has continued.
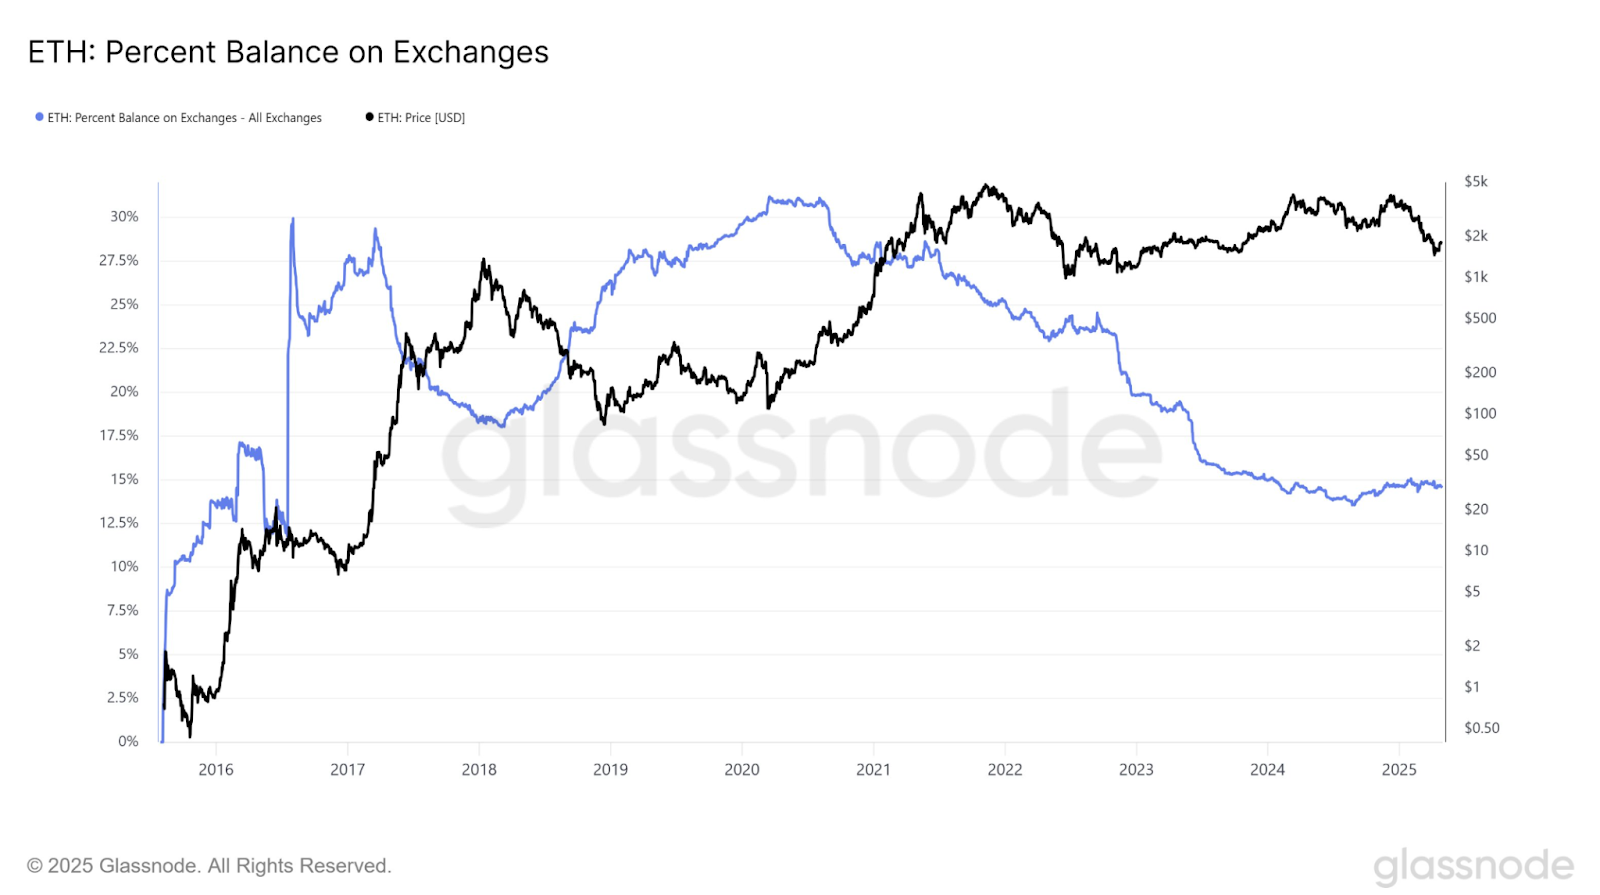
Lower exchange balances are usually a sign that investors are taking their ETH off of platforms, typically into cold storage or to stake.
This behaviour indicates less immediate selling pressure since coins held off exchanges are less likely to be traded actively.
A supply-demand imbalance can be created when supply on exchanges falls while price stabilizes.
This decline in exchange-held ETH also fits into a broader trend of staking and long-term holding.
Since the Ethereum merge and the introduction of staking rewards, more holders have decided to lock their ETH, providing a short-term reduction in circulating supply.
Delta Growth Rate and Market Valuation Reset
Additionally, Ethereum’s delta growth rate is important to look at, a comparison of market capitalization versus realized capitalization.
Alphractal’s delta growth chart indicates that the metric has now returned to a red zone, which in the past has corresponded with undervaluation.
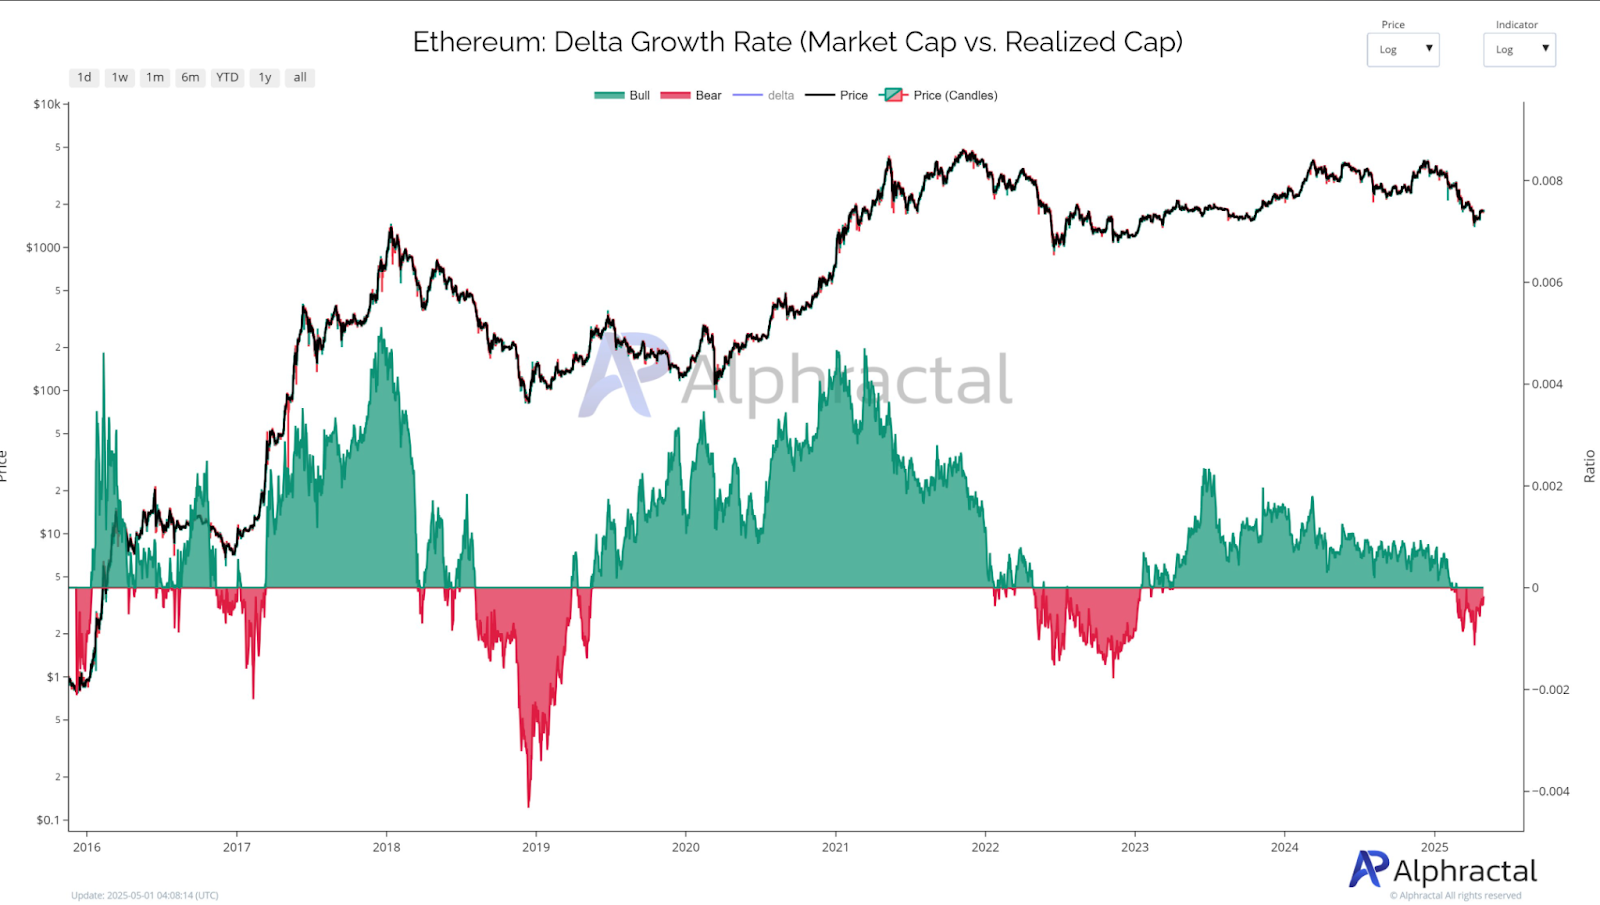
This metric stayed in red from 2018 to mid-2019 before a sharp rise in Ethereum’s market cap. It briefly repeated the same pattern in 2022.
By May 2025, the delta growth rate is back in the negative zone, however, Ethereum’s price is still around the $1,700–$1,900 level.
This may indicate that the market value has come back to a level that is close to the realized value, the value at which many long-term holders bought their coins.
If demand increases but realized value stays the same, the price could start rising again if there is not a large supply entering the market.
Public Interest and Search Volume Remain Weak
Technical and on chain data are showing early recovery signals, but public interest around Ethereum seems low.
As you can see in the following Google Trends chart, tracking search volume for the term “Ethereum” over the past five years, the current interest is near bear market levels.
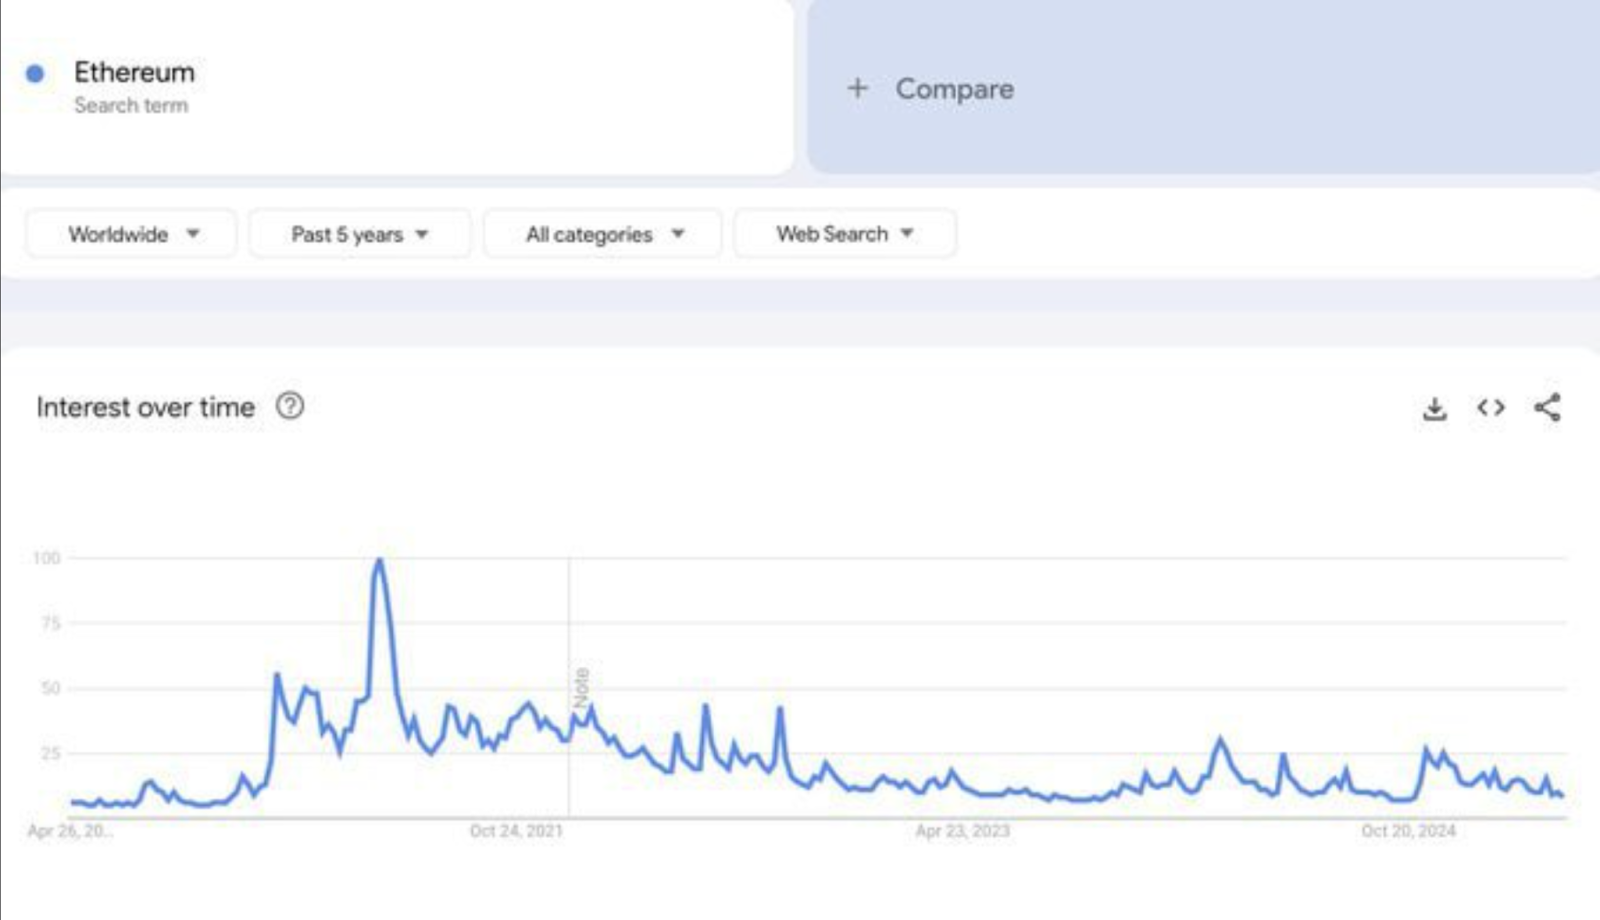
Current search activity is less than 20% of the level seen in October 2021, when interest peaked.
During key price movements, interest has increased slightly, but overall interest has remained flat during early 2025.
The lack of retail attention could indicate that any recovery is still in its infancy and is being driven by experienced market participants rather than broader hype.
In the past, when search volumes were this low, in early 2020, they usually preceded longer-term price recoveries.
The disconnect between market structure and public attention is similar to previous bottom periods, where sentiment was lagging.
With the long legged doji, reduced exchange supply, and low delta growth, Ethereum could be setting up a foundation while attention is limited.