
Key Insights:
- Binance hits record 49% share of all Ethereum exchange outflows.
- May is historically Ethereum’s best month, averaging 27.3% returns.
- ETH breaks key trendline after five months of price decline.
After falling for five consecutive months, Ethereum (ETH) has seen a renewed buying interest at the start of May 2025.
A combination of technical signals, historical return trends and early ETF inflows suggests a potential change of direction.
Although the broader crypto market is still uncertain, the data suggests that Ethereum could be starting a short-term recovery.
Ethereum Exchange Outflows Shift as Binance Gains Market Share
As per data from CryptoQuant, total ETH outflows from centralized exchanges (CEXs) have been decreasing over the past year.
But, Binance has been seeing a much bigger share of these outflows, recently reaching 48.91% of total ETH outflows. It is the highest ever recorded for Binance.
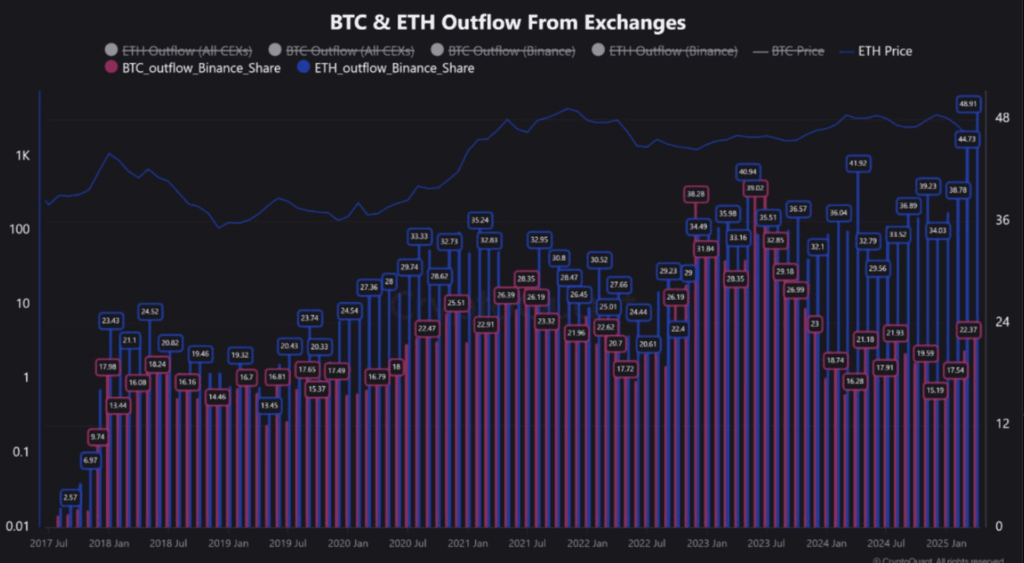
ETH price has been under pressure, but exchange outflows are often taken as a sign of holders moving coins to self-custody.
This usually indicates they don’t plan to sell anytime soon. If more ETH leaves exchanges, especially Binance, this might be a sign of longer-term holding behaviour.
Meanwhile, Bitcoin’s outflow share on Binance has been falling. According to the chart, the ETH outflow share has risen steadily from around 17% in early 2022 to almost 49% by early 2025. It shows that more Ethereum holders trust Binance as their preferred withdrawal venue.
May Has Been a Positive Month for Ethereum in the Past
Moreover, CoinGlass historical monthly return data shows that May has been Ethereum’s strongest month on average. In May, the platform reported a +27.31% average return for Ethereum in all years of record.
Ethereum rose 24.65% in May 2024, as it faced broader market corrections earlier that year. May was a strong month, but not always, as it lost -28.84% in 2022.
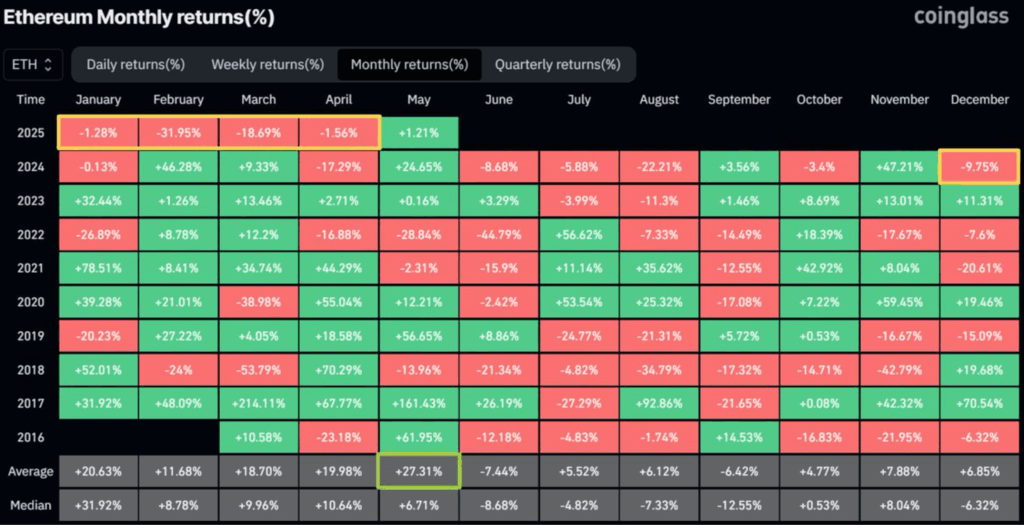
In 2025, Ethereum has fallen from over $4,000 in January to a low near $1,300 in April so far this year. The token is currently trading around $1,823, and it seems to be trying to stabilize.
May has a tendency to follow its seasonal trend and may provide a bounce after a difficult start to the year.
Ethereum Spot ETF Inflows Return But Remain Below Peak Levels
Adding to the bullish momentum, Ethereum spot ETF inflows went positive again in late April. Extended outflows were followed by the net inflows crossing the zero mark for the first time in months. Inflows were positive on May 1, 2025, but far from reaching the peak levels of late 2024.
According to CoinGlass, in December 2024, inflows jumped above $400 million, sending ETH prices above $3,500.
In contrast, March and April 2025 inflows were negative or flat, which coincided with a period of price weakness.
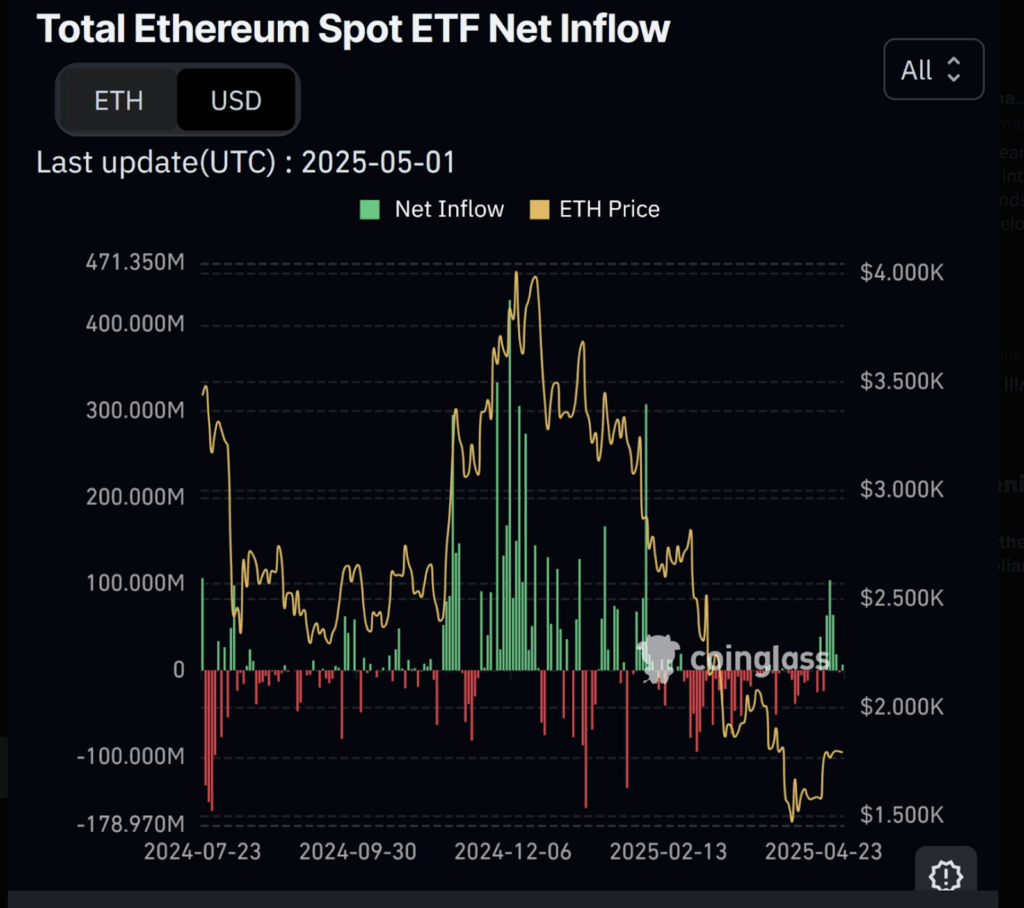
The inflows could be returning as investors start to cautiously return to Ethereum ETF products. However, the current ETH price is still below $2,000, well away from the highs seen during the 2024 ETF excitement. Investors are not fully bullish yet, but they are starting to reenter the market, the data shows.
Technical Charts Signal a Possible Short-Term Reversal
As CryptoCaesar recently posted in a technical analysis chart, Ethereum has broken out of a long descending trendline.
Since early 2025, this pattern has held and kept ETH in a clear downtrend. Price broke out near $1,700 and is now trading above that level.
It also points out a support zone between $1,600 and $1,680, which has served as a price floor. A bounce from this level could send ETH back to resistance around $2,000 and higher zones around $2,800.
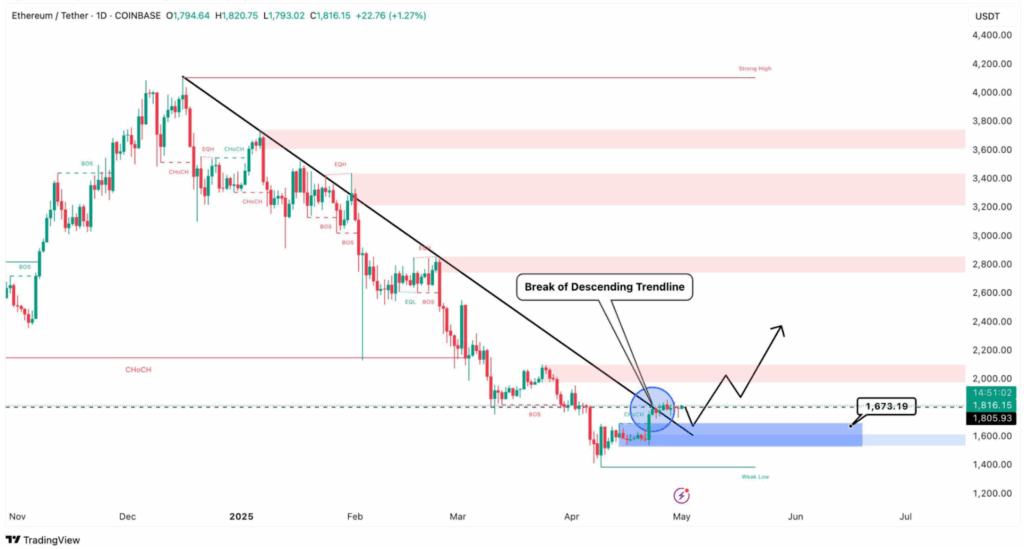
Now, short-term momentum depends on whether Ethereum can continue to stay above the trendline and hold its recent gains.
If it breaks below $1,673 as seen on the chart, it may revisit recent lows. But if the breakout sticks, it could be seen as a reason to go long by more traders.
In combination with the May seasonality, ETF inflows and rising Binance withdrawal share, these technical signs provide traders with some data-based support for a rebound this month.