
Key Insights:
- HBAR price could see a further drop of 15.50% if the sentiment remains unchanged.
- On-chain metrics reveal that exchanges have recorded a significant $5.35 million worth of HBAR outflows.
With consecutive red candles over the past week, the HBAR price has dropped by 20%. Given the current market sentiment, this ongoing bearish streak is likely to continue in the coming days, as there are no signs of improvement anytime soon.
HBAR Price and Current Market Sentiment
Amid the ongoing geopolitical tensions between Israel and Iran, not only has the price of HBAR dropped notably, but the overall cryptocurrency market has followed the same trend. Major assets like Bitcoin (BTC), Ethereum (ETH), and Solana (SOL) have also recorded price dips of over 4.50%, 9.10%, and 7.25%, respectively, in the past week.
These top assets have the potential to influence the overall market to follow the same trend, as seen in the HBAR price.
Current Price Momentum
At press time, HBAR was trading near $0.149 and had recorded a price drop of over 8.50% in the past 24 hours. However, during the same period, investor and trader participation skyrocketed, leading to a 35% surge in trading volume compared to the previous day.
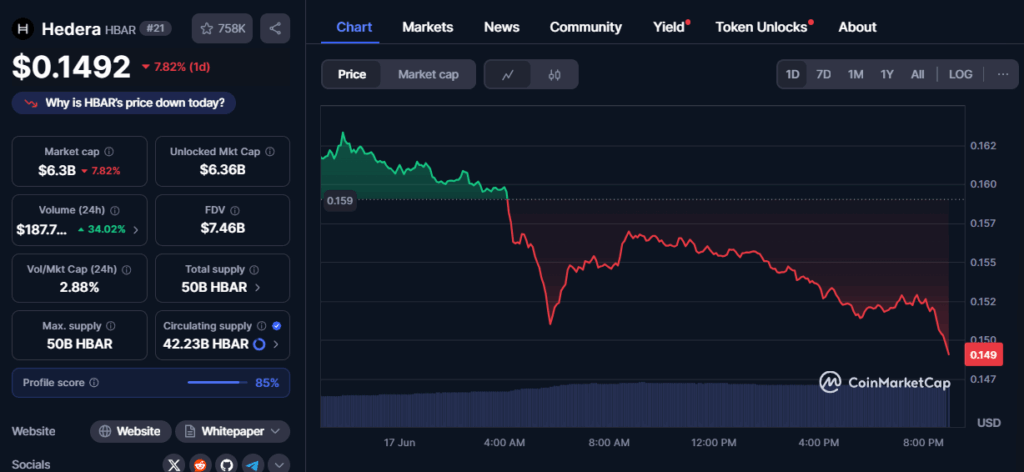
This surge in trading volume, occurring as HBAR’s price declines, indicates strong downside momentum in the asset and suggests a potential crash in the coming days. It may be a sign that traders and investors are liquidating or offloading their holdings out of fear of a broader market downturn.
HBAR Price Action and Key Levels
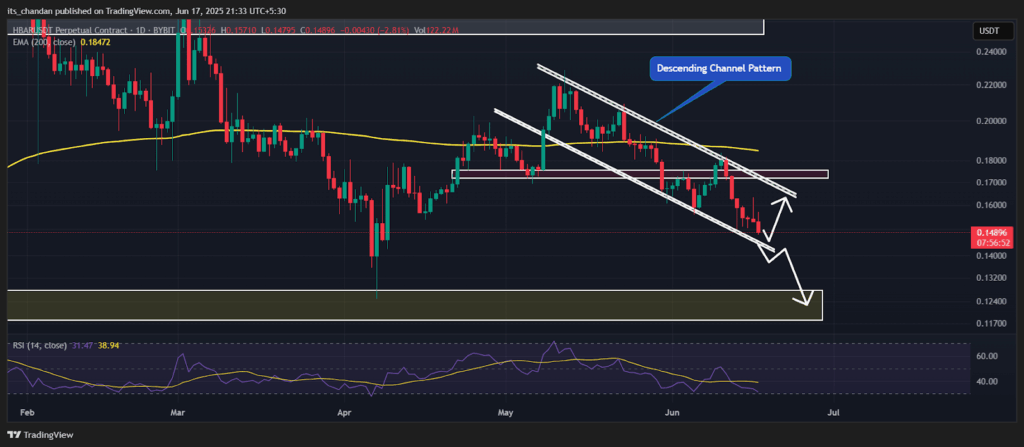
According to expert technical analysis, HBAR appears bearish and is poised for significant downside momentum in the coming days. The daily chart reveals that HBAR’s price has been hovering within a descending channel pattern, moving between the upper and lower boundaries.
With the recent price dip, the HBAR price is heading toward the lower boundary of the channel, which now appears to be a make-or-break situation for the asset.
HBAR Price Prediction for Bullish and Bearish Side
Based on recent price action and historical patterns, if the downside momentum continues and the price fails to find support at the lower boundary of the channel pattern, there is a strong possibility that the HBAR price could see a further drop of 15.50%, potentially reaching the $0.124 level in the coming days.
On the other hand, if sentiment shifts and the price manages to hold above the lower boundary, history might repeat itself. The daily chart shows that over the past few weeks, whenever the HBAR price approaches the lower boundary, it experiences buying pressure and upward momentum.
If this pattern continues, the HBAR price could see a price surge of over 15%, potentially reaching the $0.17 level in the near future.
Technical Indicators: EMA and RSI
At press time, the HBAR price was trading below the 200-day Exponential Moving Average (EMA) on the daily timeframe, indicating that the asset is in a downtrend. Investors and traders commonly use this indicator to determine whether an asset is in an uptrend or downtrend and make informed decisions based on that analysis.
Whereas, HBAR’s Relative Strength Index (RSI) stands at 31.65, indicating that the asset is nearing oversold territory, reflecting sustained bearish pressure and the potential for further downside if selling momentum continues.
$5.35 Million Worth of HBAR Outflow
Despite the bearish market structure and price action, investors and long-term holders appear to be capitalizing on the current market sentiment, as they have begun accumulating tokens, according to on-chain analytics firm Coinglass.
Data from spot inflow/outflow reveals that exchanges across the crypto landscape have recorded a significant $5.35 million worth of HBAR outflows over a 48-hour period.
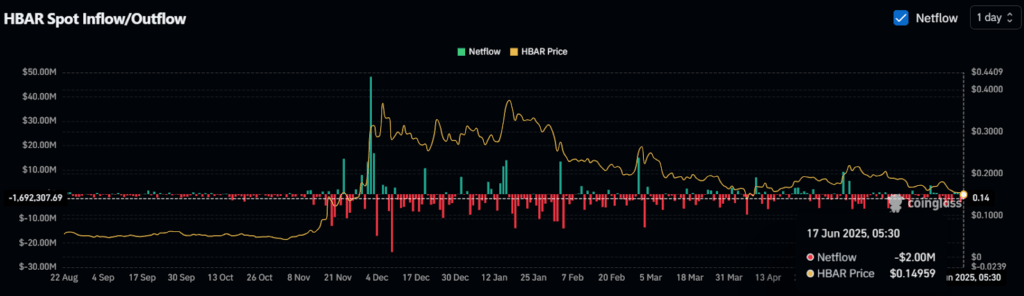
This substantial outflow from exchanges suggests potential accumulation, which may reduce selling pressure and limit further downside momentum.