
Key Insights:
- Solana’s hold above the 50-week EMA historically comes before major price rallies.
- Fibonacci trend analysis shows that Solana could target $281-$300, or aggressively $420 in a 180% rally.
- Rising open interest and negative funding rates in the futures market hint at a possible short squeeze for SOL.
Solana shows signs of a major price rally that could lead to new highs if the ongoing technical trends remain intact. SOL has been consolidating, but key indicators suggest momentum is building.
On-chain data signals that a potential breakout is nearby. Here’s a look at the factors behind this surge and what could derail it.
Holding the 50-Week EMA
Solana recently tested the $180 resistance level but failed to hold steady for a breakout. However, the bigger story comes from its ability to hold above the 50-week EMA for three consecutive weeks. Holding this level has historically always been a major springboard for major rallies.
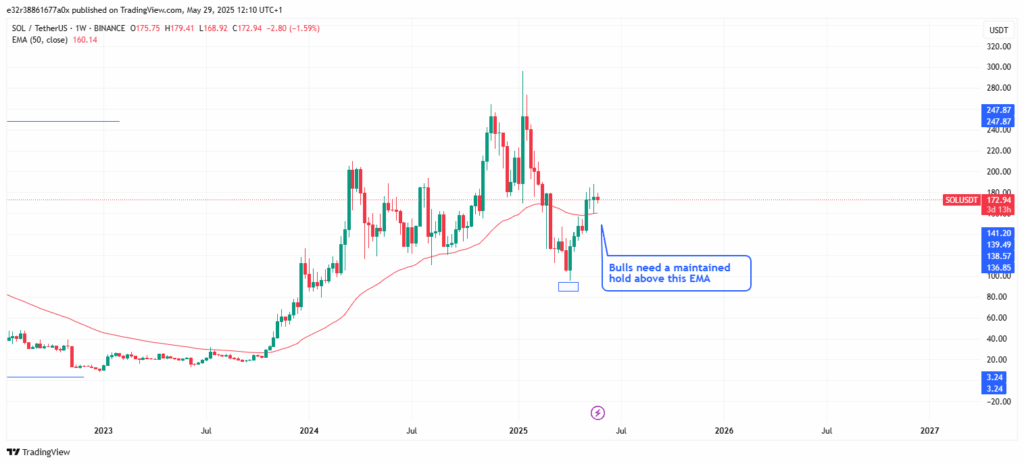
For example, in late 2023, Solana broke past both the 50-week and 100-week EMAs. This move was followed by a staggering 515% price increase by March of the following year.
The current relative strength index (RSI) on the weekly chart sits at 52.60, showing that buying pressure is rising. Therefore, there could be room for upward movement.
If history repeats, SOL may be gearing up for another major climb. Technical analysts believe a maintained close above the 50-week EMA could support a rally toward the $300 mark.
Fibonacci Trend Analysis
Zooming out to the daily chart and the Fibonacci retracement tool, a few interesting price points start to come up. The swing low near $95 to January’s high of $295 suggests a price extension. The target ranges between $281 and $300, marking a 70% potential increase.
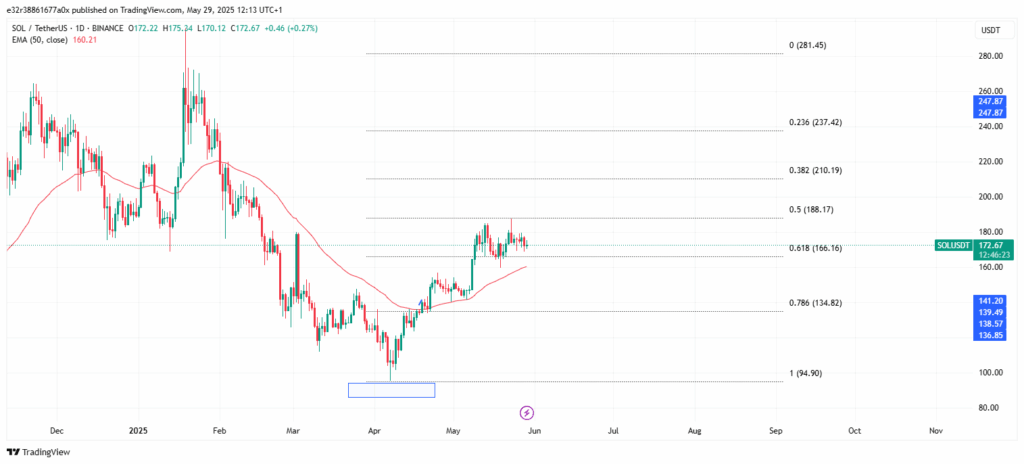
If SOL enters price discovery mode, bulls may eye the 1.618 Fibonacci extension, which sits somewhere around $420. This alone would be a 180% rally from current levels. However, this outlook is only valid if SOL holds the 50-week EMA.
If it fails to maintain that support, the token could revisit its lower support levels between $152 and $157. This scenario would invalidate much of the short-term bullish momentum.
Futures Market Hints at a Possible Short Squeeze
Aside from technical charts, the futures market is also showing signs that a breakout may be incoming. For example, Coinglass data shows that Solana futures open interest (OI) is close to the $9 billion high from January 2025.
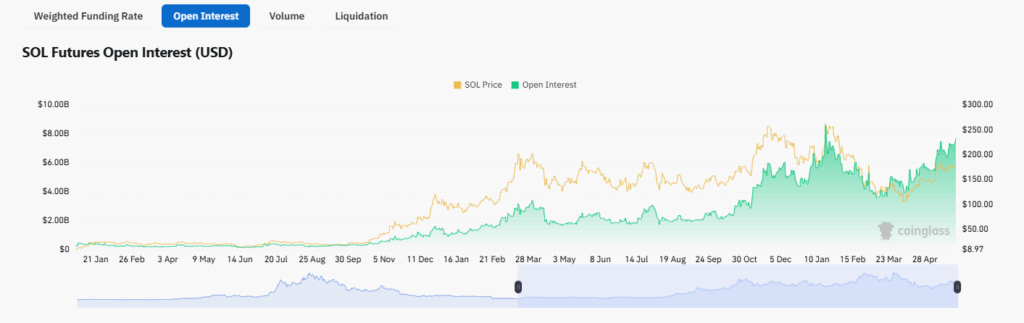
This rise in OI shows strong speculative activity and often points towards incoming price volatility. On the other end of the fence, funding rates across multiple exchanges have turned negative. This means traders are betting against SOL, and are taking short positions while expecting of a price drop.
While bearish sentiment might seem like a red flag, it could be a major trend-setter for a classic short squeeze. If SOL breaks above its aforementioned resistance levels, short sellers could be forced to buy back their positions and accelerate the price surge.
Double Top Formation on Shorter Timeframes
While the longer-term charts seem promising enough, short-term technicals show signs of incoming issues within this timeframe.
For example, popular trader Carl Moon recently pointed out a possible double top pattern on the 4-hour chart. If this bearish pattern plays out, SOL could retrace to the $152–$157 range in the short term.
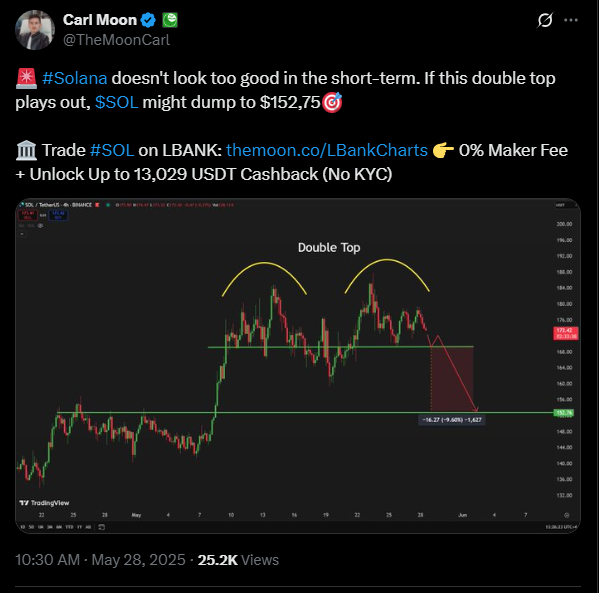
The $180 level so far, is the biggest inflection point for traders. A clean breakout and daily close above this resistance would validate the bullish outlook. On the other hand, repeated rejections at this level may lead to a healthy (albeit painful) correction.