
Key Insights:
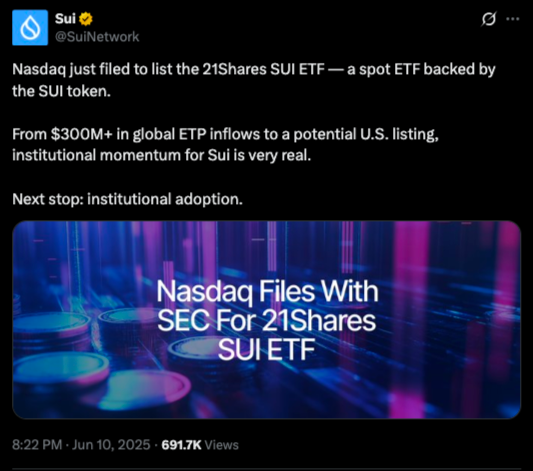
- Nasdaq filed 21Shares SUI ETF, starting the SEC review process.
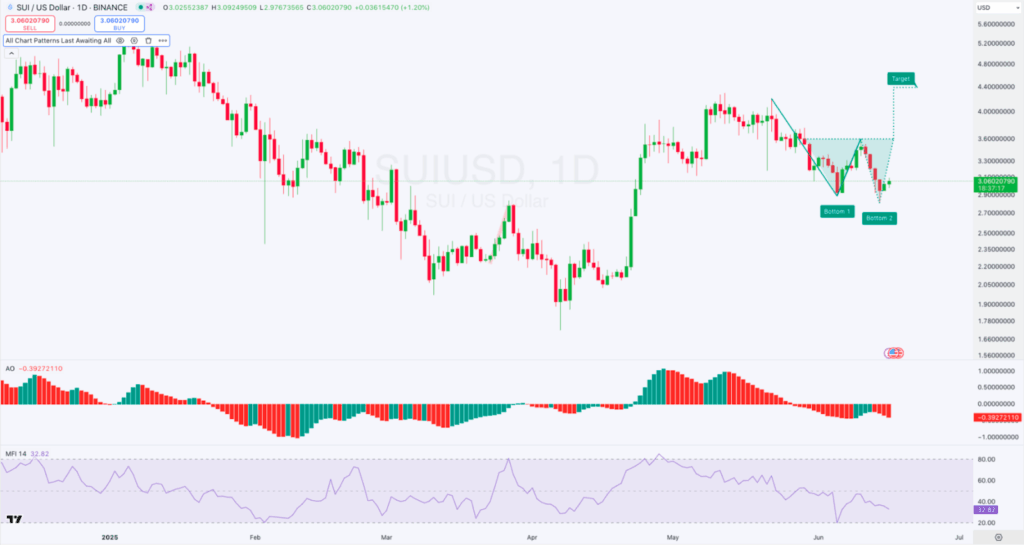
- SUI forms double bottom $4.40 target hinges on breakout.
- Over $300M invested in SUI ETPs amid growing institutional demand.
Nasdaq submitted a Form 19b-4 to have the Nasdaq-listed 21Shares SUI ETF issue with the U.S. Securities and Exchange Commission (SEC). This might be part of a landmark moment in U.S. market history.
This potential spot exchange-traded fund would directly own such SUI tokens. It would be the first official giant leap toward making SUI accessible to a broader range of institutional and retail investors in the United States.
The ETF submission is based on an earlier 21Shares filing of S-1 filed in April and follows the SUI exchange-traded products.
These are already traded on Euronext Paris and Amsterdam. The Sui Foundation stated that in excess of $300 million has been invested around the world in SUI-based exchange-traded products, with VanEck, Franklin Templeton, and Grayscale amongst the mainstream participants.
SUI has reacted with fainting upward momentum, rising 2.09% in the last 24 hours to be quoted at $3.06 at the press time of this writing, per CoinMarketCap.
Even after the 23.44% decrease in 24-hour trade volumes to $710 million, SUI has a market cap of $10.39 billion and 3.39 billion tokens in circulation out of a total supply of 10 billion.
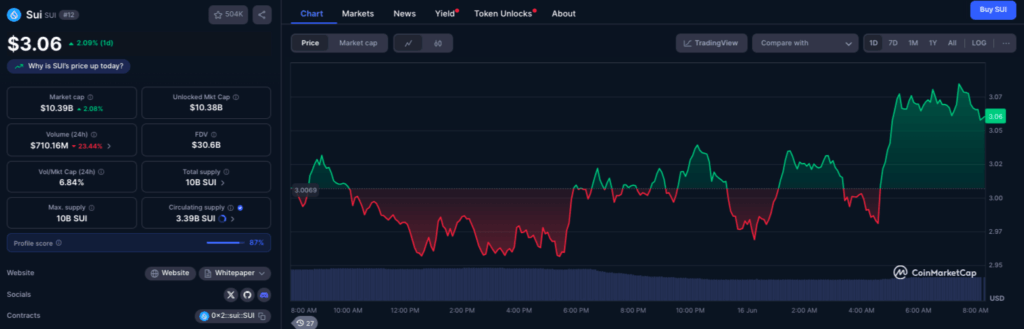
On intraday price action, there has been an intraday rebound off a low of $2.97, with the prices rising steadily into early June 16 trading hours, with a last session high of $3.07.
This bounce is after some spastic formations at the level of consolidation of the quotations of the asset at around the $3 psychological price, as illustrated in the hourly chart.
The late overnight trading volume ramped up slightly, confirming the recovery move, but it should not be considered conclusive, being too small an increase.
Daily Chart Structure: Double Bottom Formation Emerges
The weekly chart will have a closer picture of a possible reversal pattern that is currently underway. SUI has made a complete textbook twice-bottom formation; recording the first trough at around $2.88 and the second bottom at $2.97, all within the month of late May-mid June.
The resistance found at the neckline lies narrowly below the level of $3.30. An actual breakout above and confirmation may justify the bullish breakout, and provide access to a technical target proximate to $4.40, which was determined by the degree measured vertically between the neckline and the bottom.
Nevertheless, this action is still subject to breaking out above resistance, and the present structure is yet to be verified. The 21Shares ETF listing introduces one of the fundamentals that may facilitate this breakout. This is based on when the SEC reviews this listing request and the pace of the overall market.
Momentum indicators denote a market in transition. The AO has fatigued even further, but it has dropped back into the negative region with -0.39, and short-term momentum is weak even after the price rise. What this means is that buyers have not entirely controlled the strength of the trend.
In the meantime, the Money Flow Index (MFI) stands at 32.82, being relatively close to the oversold zone. This denotes a possibility that the token experienced powerful outflows during previous sessions.
This might be set up to experience accretion in case of continued purchasing intensity. An overbounce on the 40-level by MFI would further authenticate the reversal of the trend and the surety of the investors.
Sui ETF Approval Could Fuel Capital Inflows and Price Discovery
The SUI ETF filing does not necessarily mean that the SEC will approve of it, but it marks a significant step towards establishing it as an institutional, legitimate entity. Historically, spot ETFs bring asset transparency and greater liquidity as masses of capital flow into them.
A green light on a U.S.-listed SUI ETF could put SUI in company with other assets, including Bitcoin and Ethereum, in regulated investment portfolios.
The U.S. listing will open up the market broadly, as over 300 million SUI-based exchange-traded products are already deployed worldwide. Nasdaq’s participation also bolsters SUI’s growing position within the Layer 1 ecosystem, though first of all, in the rivalry with such networks as Solana and Avalanche.
This exchange-traded fund milestone follows the fact that total value locked (TVL) on the Sui network exceeds 1.75 billion dollars, showing more widespread adoption in DeFi and infrastructural development. Coupled with the growing flow of stablecoins and liquidity in BTC shifting chains, institutional trust in Sui’s performance and scalability may further increase in the quarters ahead.
With the Nasdaq filing of the 21Shares SUI ETF, the SUI ecosystem will experience a potential game-changer. The technical framework in the daily chart indicates that a reversal is in the making, which is enhanced by the institutional narrative attached to the ETF.
Despite short-term signals that are still bearish, the triple whammy of double bottom formation, stabilization of price above the 3.00 barrier, and the re-emergence of fundamental interest may provide the setup for a decisive directional move.