Key Insights:
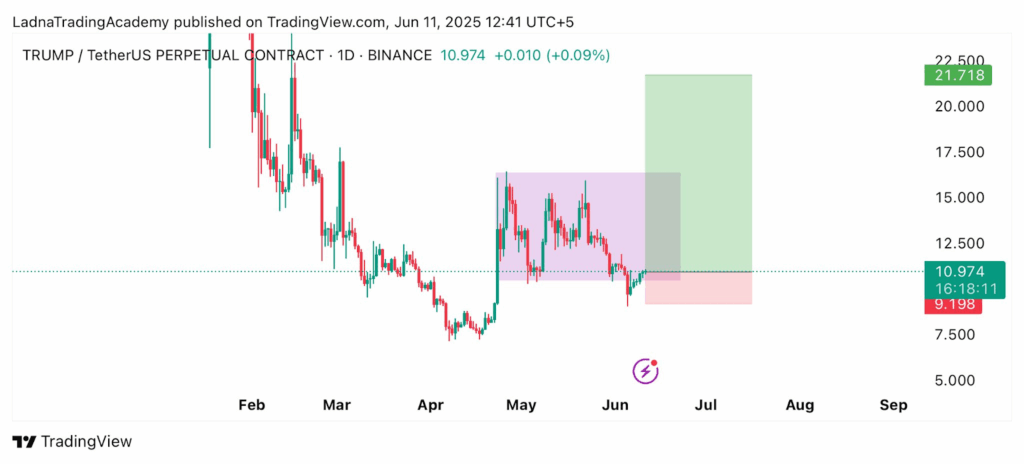
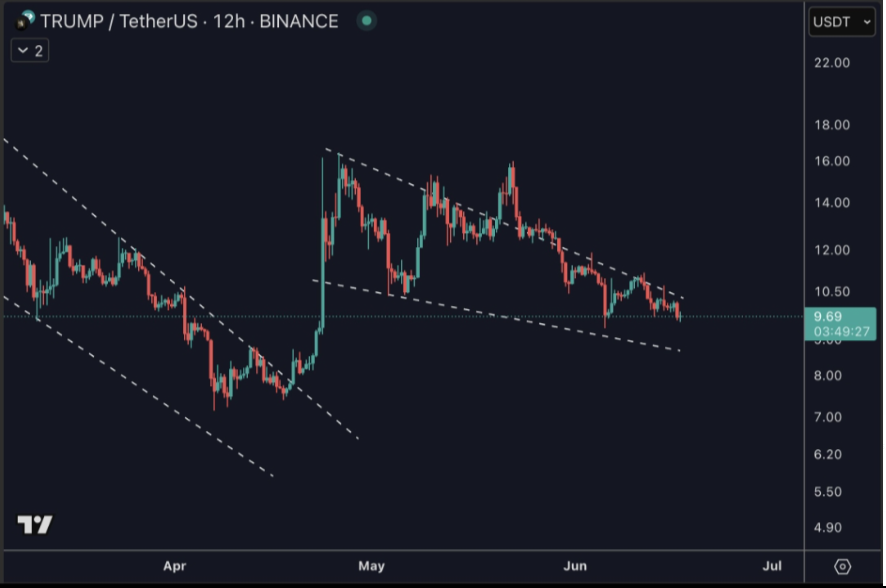
- TRUMP/USDT is in a definite fall having reached its maximum at the level of 16.01.
- The TRUMP funding rate graph illustrates the obvious fight between long and short positions at top exchanges in the period between the end of March and mid-June.
- The liquidation map of the Bybit trump/USDT showed that there were significant amounts of short positions being closed above the current price.
TRUMP crypto was in a definite fall having reached its recent maximum at the level of $16. The price gave the same previous break of highs of $13.18, and then was rejected at $12.04 and then $11.92.
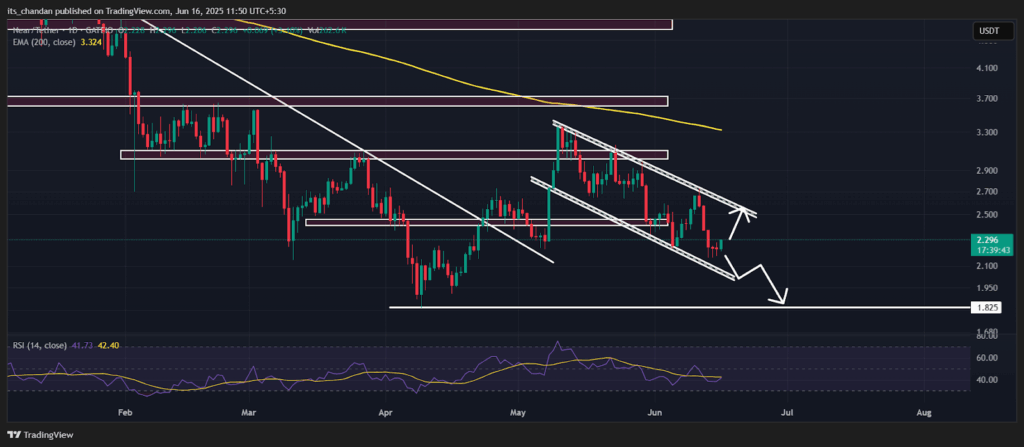
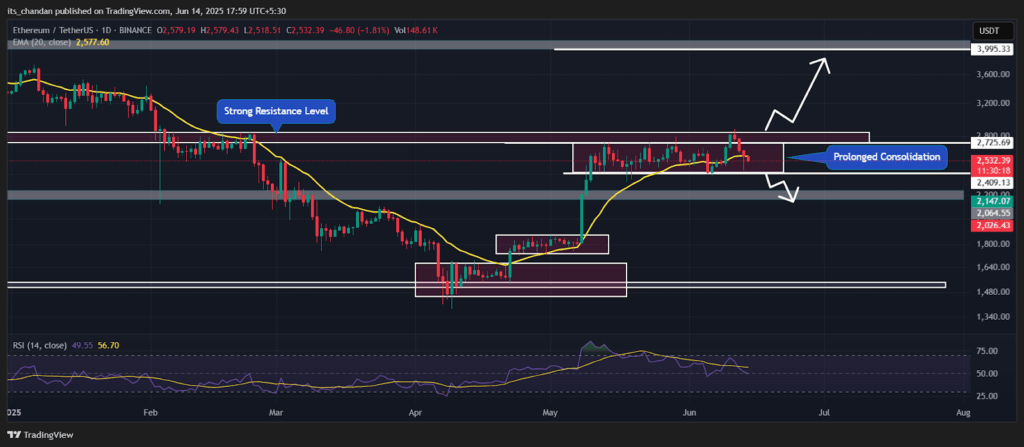
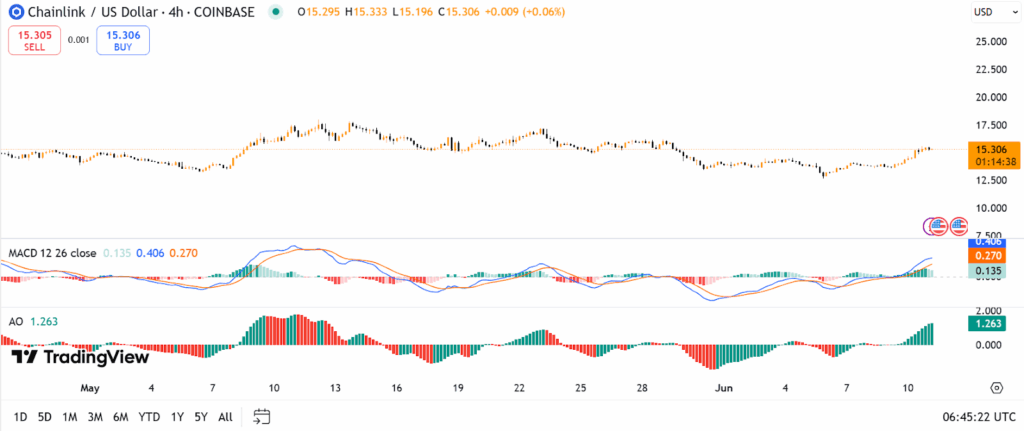
TRUMP Crypt Price Action Analysis
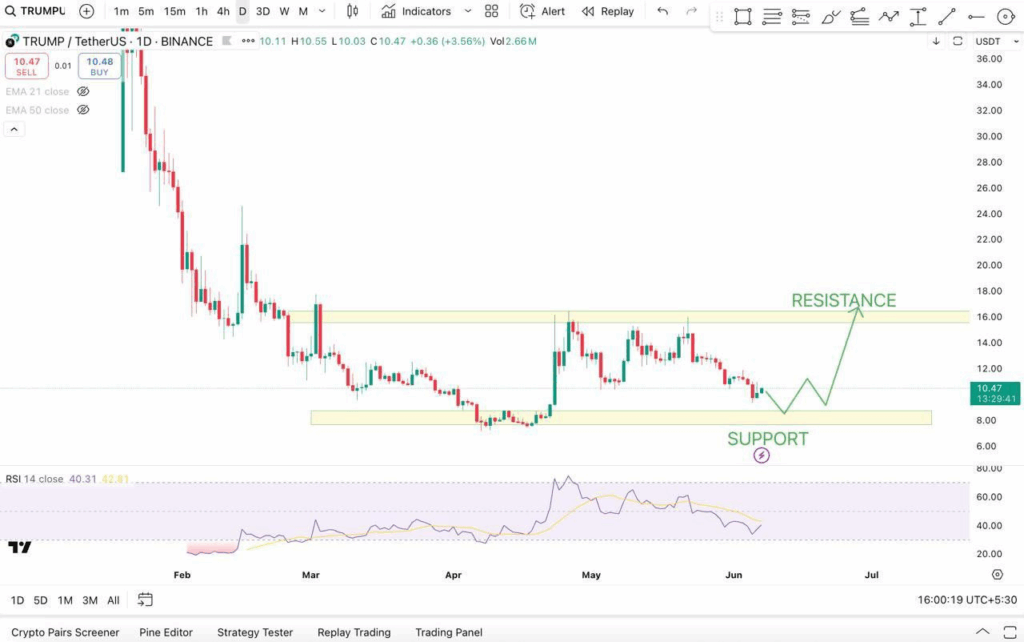
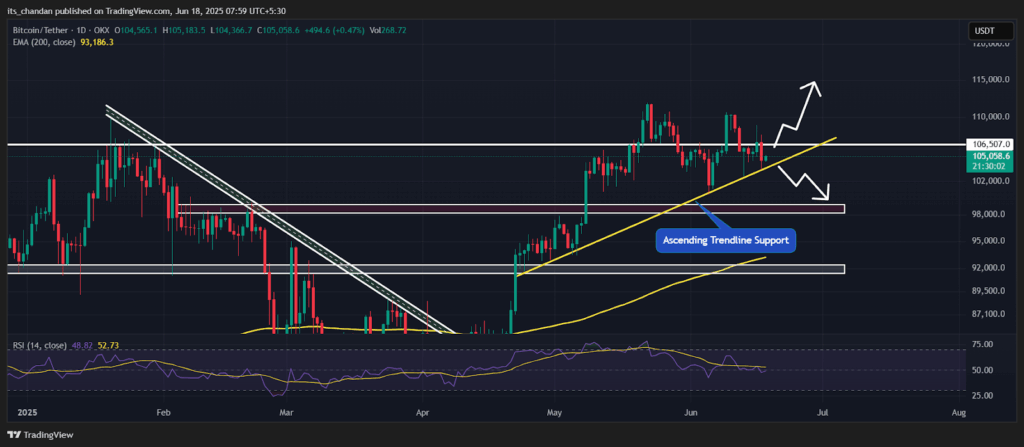
Trump crypto chart pointed to the bearish movements that were enclosed in a descending wedge pattern. The price had just crossed the major resistance at $10.60 then and lay close to the $9.60 $9.80 support area.
There already had been bearish flag breakdown, weak recovery attempts did not break the upper trend line. Short setups were eyed between $10.20 and $10.50 on a potential retest.
The target zones were still at the level of $9.80 and $9.40 with invalidation at $10.75.
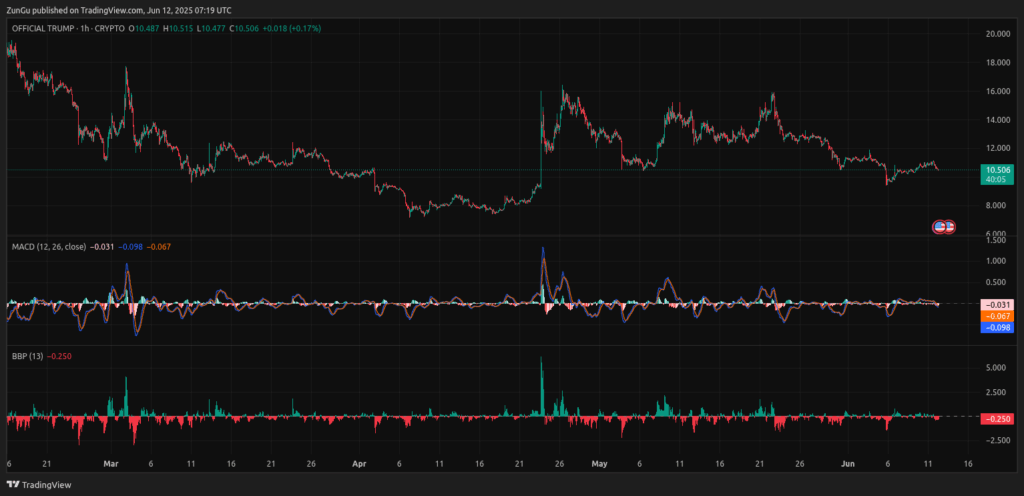
Momentum and price chart objects were consistent with the downside relapse unless a firm advance beyond the $10.60 mark was achieved. Momentum remained on the bearish side according to new candles and structure.
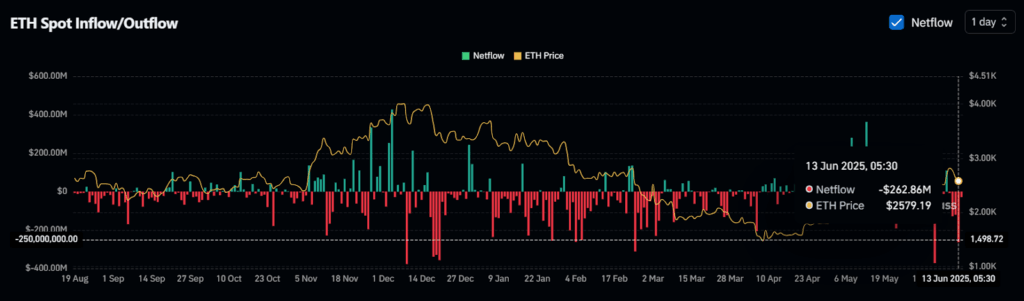
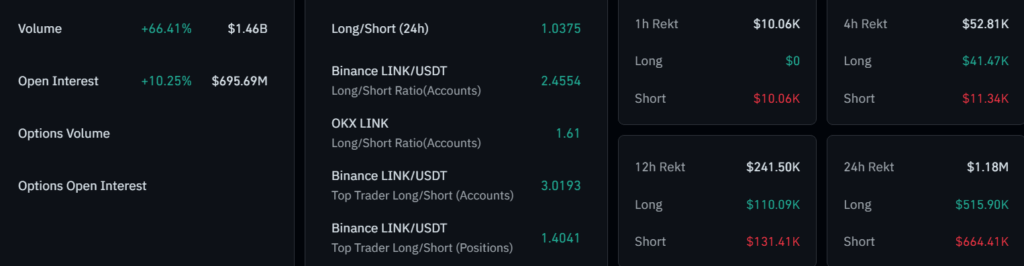
TRUMP Funding Rate
The TRUMP funding rate graph illustrated the obvious fight between long and short positions at top exchanges in the period between the end of March and mid-June.
The funding rates that determine the mood in the market in perpetual futures were almost negative throughout April and May indicating control by short sellers.
This went along the price of TRUMP trading sideways at a range between $9.00 and $11.50.
Peaks in positive funding rates would occur on limited occasions and would frequently revert quickly, as it happened on and about April 22, and on and about May 20.
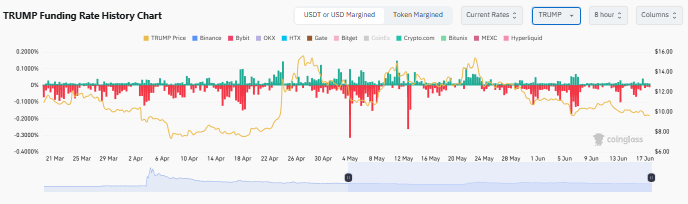
Such rallies implied a bullish mood, probably brought by the price thrusts that exceeded $13.00 but formed temporarily before the retracements.
The rates of funding, in general, were the highest on exchanges such as Hyperliquid and Crypto.com, whereas on Binance and OKX the rates were more balanced.
The figures by the end of July have continued to stay on a negative funding rate with the exception of the p2p exchanges and the funding rates returned to a negative on most exchanges, such as Binance and Bybit.
It implies the reinstatement of short positions, yet the TRUMP token has maintained the above-mentioned support level of $9.00.
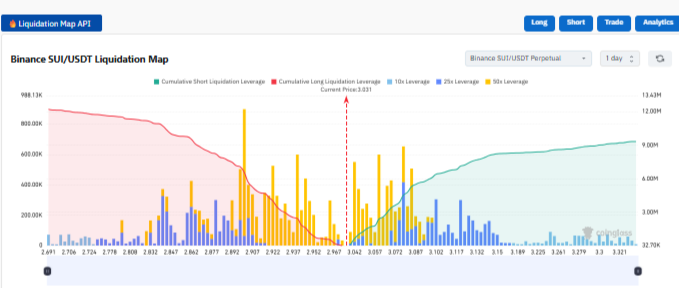
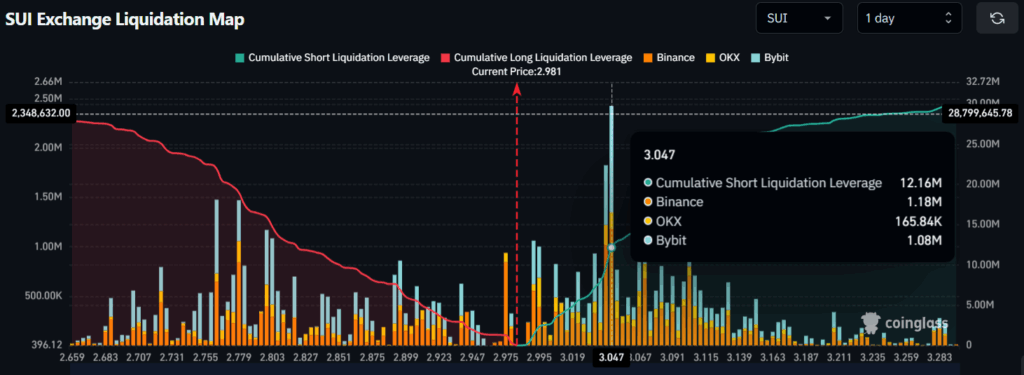
TRUMP Liquidation Map
The liquidation map of the Bybit trump/USDT showed that there were significant amounts of short positions being closed above the current price, with some trades being executed higher than $9.70.
There was also a sharp increase in combined short liquidations between the price of $9.80 and $10.10 with high leveraging positions being cleaned out, notably the 25x and the 50x queues.
This implied violent shorting, which became snared as it rose in price.
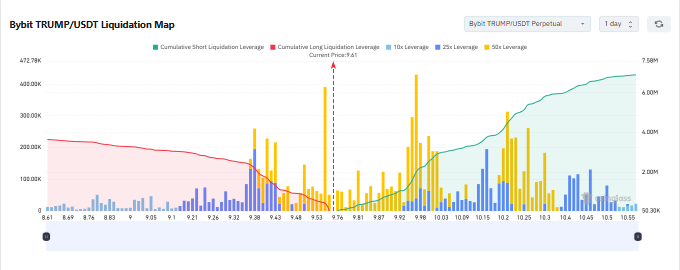
On the other timeframe, there were cumulative long liquidations that had accrued at below the range of $9.60, which however were less than the short squeeze above it.
When the price moved above $9.80, the green curve peaked, indicating that long positions were forced to settle down through short sales.
The latest information indicated a strong liquidation area of between $9.80 and $10.20, and it was an attractor to the price, a magnet. Such a liquidation squeeze promoted a short-term bullish reversal because bears got surprised.
In sum, the new initiative signaled that TRUMP experienced a healthy rally stemmed from forced shorts selling, which reversed the momentum back to bulls.


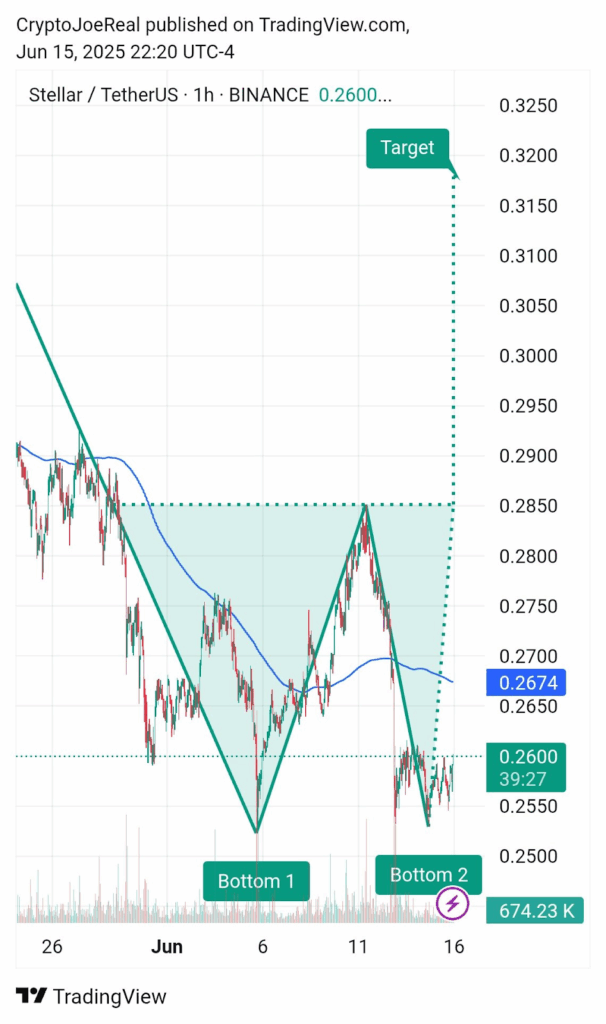
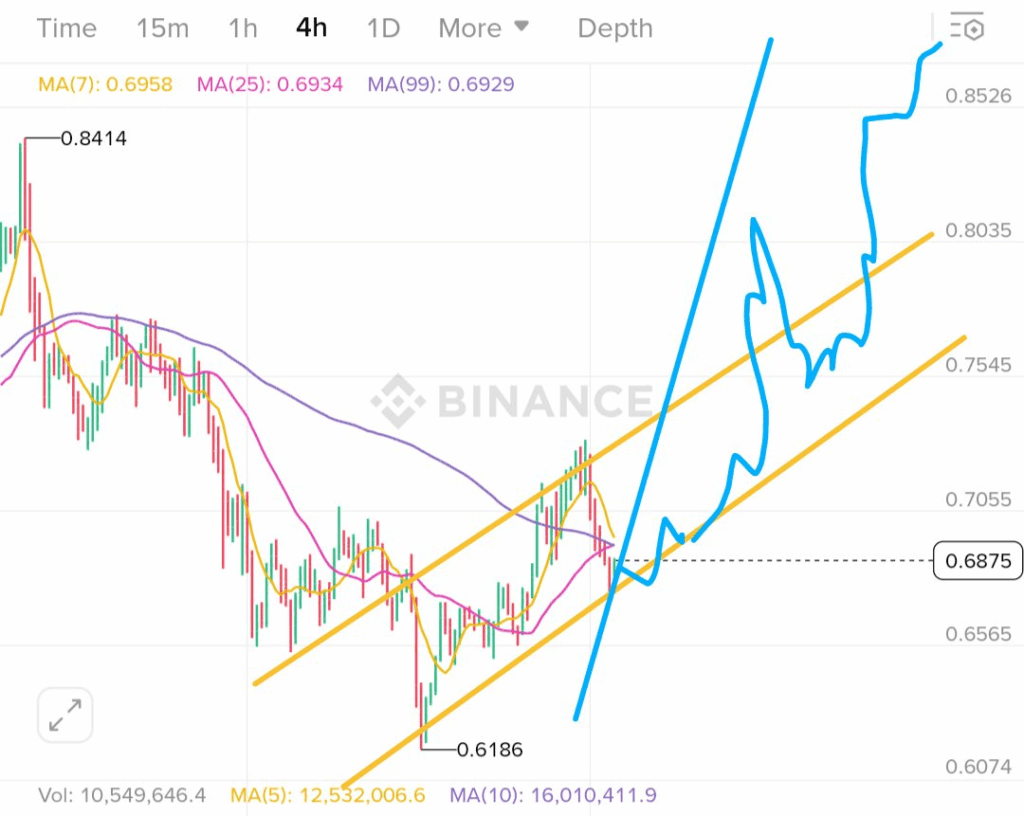
 Crypto Price Eyes Breakout Following $0.2500 Retest")