Key Insights:
- Cardano whales bought 120 million ADA in 48 hours, increasing market confidence amid rising Bitcoin and Ethereum prices.
- ADA struggles below $0.70 despite whale activity and Cardinal’s launch, while the wider crypto market shows strong gains.
- Cardinal protocol allows decentralized Bitcoin access in Cardano DeFi, removing centralized bridges using wrapped UTXO and MuSig2.
After bouncing from support around $0.62 last week, Cardano’s (ADA) price recovery has stalled below the $0.70 mark. At about $25 billion, the token was trading near $0.68 and is down slightly more than 1% on Tuesday. In contrast, major cryptocurrencies such as Bitcoin and Ethereum have been doing well.
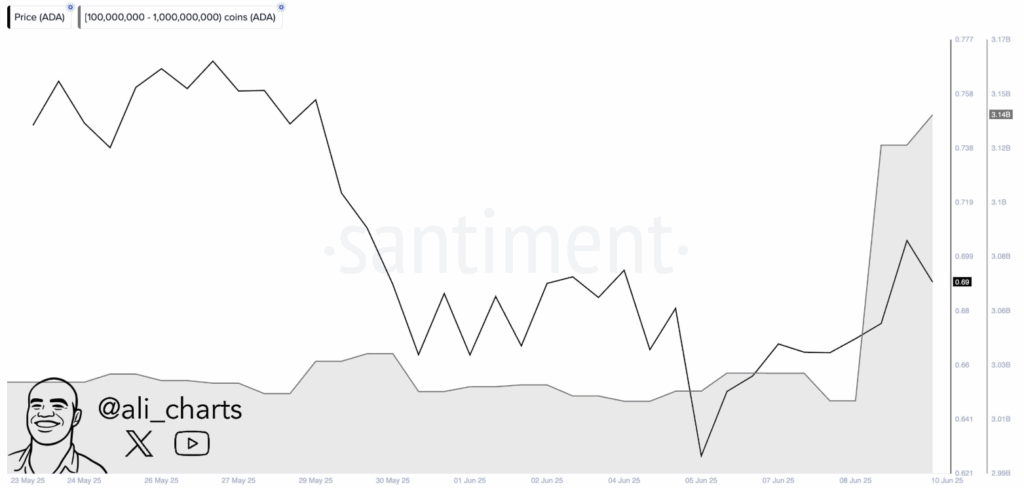
This slow uptrend is in sync with the launch of the Cardinal protocol, a project that looks to integrate Bitcoin into the Cardano DeFi ecosystem. Meanwhile, whale wallets have been accumulating over 120 million ADA worth more than $120 million in the last 48 hours, indicating growing institutional confidence.
Whales Intensify Accumulation as Market Sentiment Turns Bullish
In the last two days, whales have bought over 120 million ADA, causing Cardano to see a huge spike in large wallet accumulation. Institutional investors have been showing strong signals of confidence in recent weeks, and this is one of the strongest.
On-chain data shows that these purchases were made during ADA’s attempt to bounce off of multi-week lows.
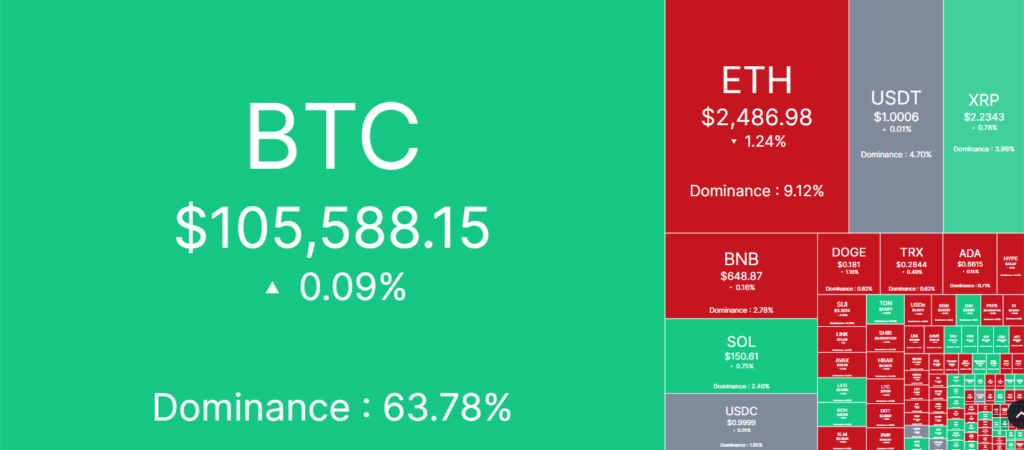
Bitcoin and Ethereum have also led the broader crypto market to bullish momentum. Bitcoin is trading at around $109,600, up 3.81% in the last 24 hours, while Ethereum has gone up 7.61% to $2,678. Global market cap has hit $3.57 trillion and the Fear & Greed Index is at 71, meaning everyone is confident.
Despite this, Cardano is still within the top ten cryptocurrencies by market cap and has managed to record over $800 million in daily trading volume. But, ADA still trades below its key resistance levels. Liquidity is increasing and long positions are building but a sustained breakout will need to be above $0.70 and $0.77.
Cardinal Protocol Bridges Bitcoin to Cardano’s DeFi Layer
Adding to the bullish momentum, the launch of Cardinal represents a significant milestone for the Cardano ecosystem.
Cardinal is a decentralized protocol that lets Bitcoin holders utilize DeFi services such as lending and borrowing directly on the Cardano blockchain. Wrapped UTXO and MuSig2 cryptographic security mechanism eliminates centralized intermediaries.
This protocol is compatible with Ethereum, Solana, Avalanche and other networks. Off-chain verification is done using BitVMX, while on-chain validation is done using Cardano’s smart contracts. This allows for a seamless integration between Bitcoin and the Cardano DeFi ecosystem without the need of custodians.
The system is not yet production ready but the developers confirmed that they continue to make improvements until they reach a full version 1.0.
Users can burn wrapped tokens and get native Bitcoin at any time with greater trust and flexibility thanks to Cardinal. This is expected to make Cardano a stronger force in multi-chain DeFi development.
Technicals Show ADA Pressing Against Key Resistance
At press time, Cardano is trading at around $0.68 and is getting close to a critical resistance level at $0.72. On the 3-day chart, ADA has been moving inside a descending parallel channel since early Q1 2025.
The price action is close to the channel midline, and a close above $0.70 would confirm a possible breakout from this formation.
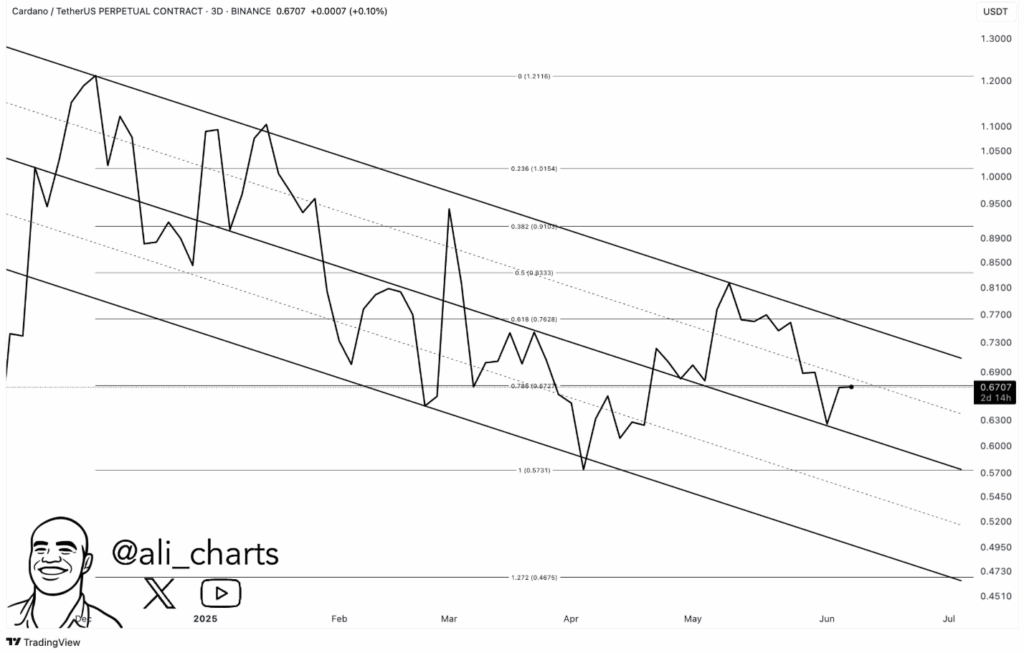
Trading volume was on the rise at the time of writing, indicating rising demand. The whale accumulation and overall market rally had turned momentum positive. If ADA can keep its gains above $0.69, it could quickly move toward $0.75.
Further resistance was placed at $0.77 (0.618) and $0.83 (0.5), and strong support was found at $0.62 and $0.573. In the past months, these zones had been repeatedly tested.
If ADA is rejected from current levels, it could fall back to the lower channel boundary, but buying pressure continues to keep bulls in control.