
Key Insights:
- The California State Assembly unanimously passed AB 1180, moving California closer to accepting crypto for government payments.
- AB 1180 aims to establish a pilot program, allowing state agencies to test crypto payment systems for various fees.
- The bill mandates a DFPI report by January 2028 on the pilot’s progress.
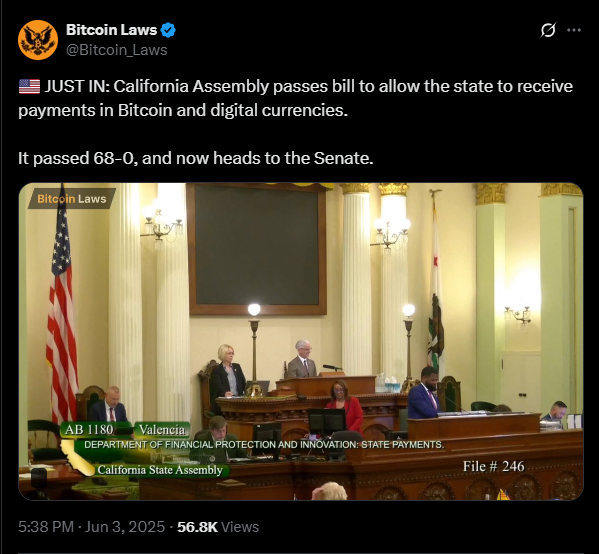
California, known for leading the way in innovation, has moved closer to embracing crypto at the government level. On 2 June, the California State Assembly unanimously passed Assembly Bill 1180 (AB 1180).
This has set the stage for state agencies to accept digital assets like Bitcoin for public payments. California’s State Senate is considering a crypto-related bill.
If signed by Governor Gavin Newsom, it could integrate crypto into government operations. This would make California one of the first major U.S. states to do so.
What Is AB 1180?
Assembly member Avelino Valencia introduced Assembly Bill 1180. It is geared toward California’s Department of Financial Protection and Innovation (DFPI).
The bill aims to set up a legal framework allowing state agencies to accept crypto. This would fall under the more general Digital Financial Assets Law (DFAL).
Rather than rolling it out all at once, the bill proposes a pilot program from July 1, 2026, to January 1, 2031. During this time, state departments will be able to test crypto payment systems for things like fees, fines, or permits.
One of the major aspects of AB 1180 is its focus on transparency and accountability. The DFPI must submit a progress report by January 1, 2028.
It will detail the number of crypto transactions conducted. The report will also address technical challenges, operational issues, and legal ambiguities. This data will be important for deciding whether the program should continue, expand, or be adjusted before its 2031 end.
Incoming Mainstream Use of Crypto
AB 1180 isn’t an isolated move. It’s part of a more general movement across the U.S. to integrate crypto into everyday life. States like Florida, Colorado, and Louisiana have implemented similar programs. This allows limited crypto payment forms for government services.
California, however, is bringing a new weight into the movement. California is a major tech hub and the most populous U.S. state. Its embrace of crypto could boost national popularity and drive broader adoption.
At the time of writing, more than 117 businesses in California now accept Bitcoin, according to BTC Maps. If state agencies begin accepting crypto, that number could grow on a massive scale.
AB 1180 supporters argue that government adoption would ease public hesitation around crypto and help the digital economy scale better.
The “Bitcoin Rights” Companion Bill
AB 1180 isn’t the only crypto-focused bill making waves in California. Assembly member Valencia is also behind Assembly Bill 1052 (AB 1052), often called the “Bitcoin Rights” bill.
AB 1052 aims to protect Californians’ rights to hold and use digital assets in private transactions. It also prohibits government entities from imposing taxes or restrictions on self-custodied digital currencies.
In short, the bill acknowledges crypto as a legitimate tool for private commerce and personal finance. On May 23, AB 1052 cleared its first committee hearing with an 11-0 vote. It is now advancing further in the legislative process.
If both bills pass, California will have one of the most crypto-friendly legal frameworks in the U.S. This will promote both private and public use of digital assets. The state’s support could accelerate broader adoption of crypto.
Together, these bills would ensure that crypto is protected and usable in private and governmental contexts. A February 2025 Coinbase poll found strong support for pro-crypto candidates in California.
80% of crypto holders would back politicians who advocate for crypto adoption. These factors combined could help California see even more progressive bills.


