
Key Insights
- Over $13M in long liquidations stacked below $2 signals a high risk of a cascading breakdown for XRP.
- XRP options open interest jumps 131%, showing whales and institutions positioning for a significant price shift.
- Longs continue to be flushed out, potentially marking the final shakeout before a decisive market reversal.
XRP is in a high-stakes zone as the price consolidates just above $2, with over $13 million in liquidations waiting. A sharp cascade could follow if the support breaks, driven by high leverage and thinning demand.
However, surging options, open interest, and a steady macro structure imply that a bigger move is coming. If XRP breaks down or bounces sharply from this key level, the question remains.
Derivatives Surge as Whales Anticipate Volatility
The surge in XRP’s options open interest of 131% indicates that big players are gearing up for a big price move. Options volume also soared by 102%, and total futures open interest remained at nearly $3.9 billion. It means traders are betting on direction, expecting volatility.
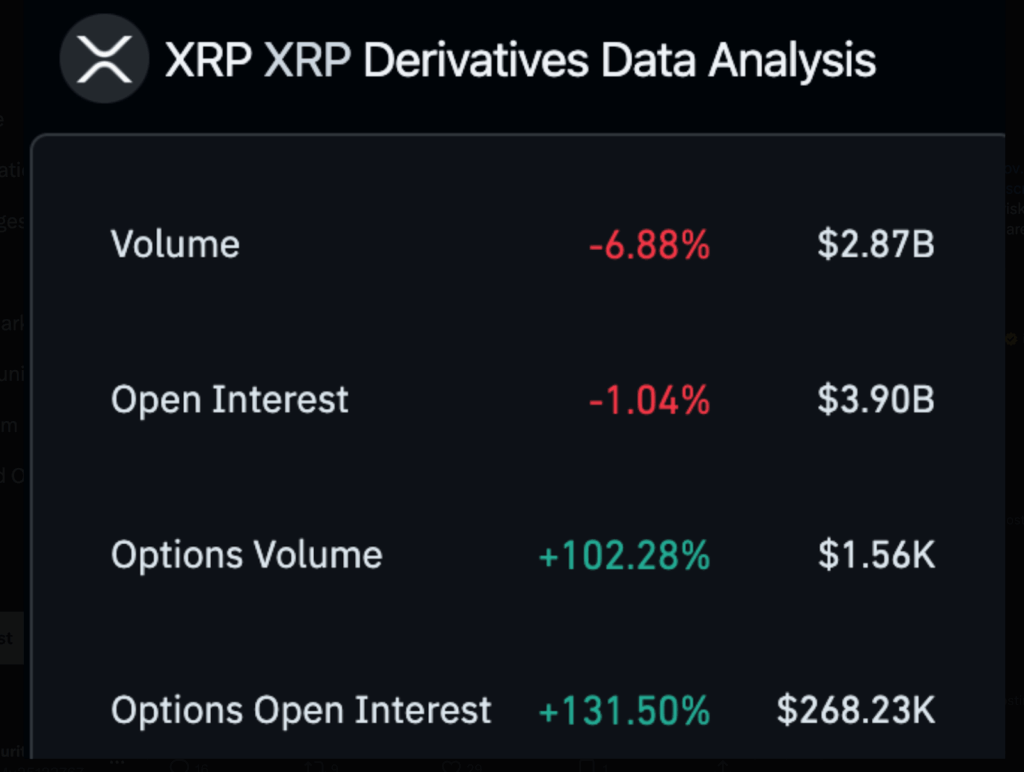
The total volume declined by 6.8%, but the options activity suggests preparation, not retreat. Long exposure could be hedged, or traders could speculate on a breakdown or breakout.
Positioning is large, which indicates a move is coming, and leverage is still high across platforms. Usually, whales lead in derivatives positioning before a big swing happens. According to current data, they are focusing on the $2 level, where there is a lot of liquidity.
If the price stays above this zone, it could lead to short liquidations. However, long liquidations could accelerate very quickly if it breaks.
Liquidation Heatmaps Point to Critical Support at $2.00
Heatmap data indicates nearly $13 million in long liquidation levels, packed very tightly between $2.00 and $1.95. You can see these levels on major exchanges.
This means traders are heavily leveraged at this price floor. If it breaks below $2, it will most likely trigger a sell-off cascade.
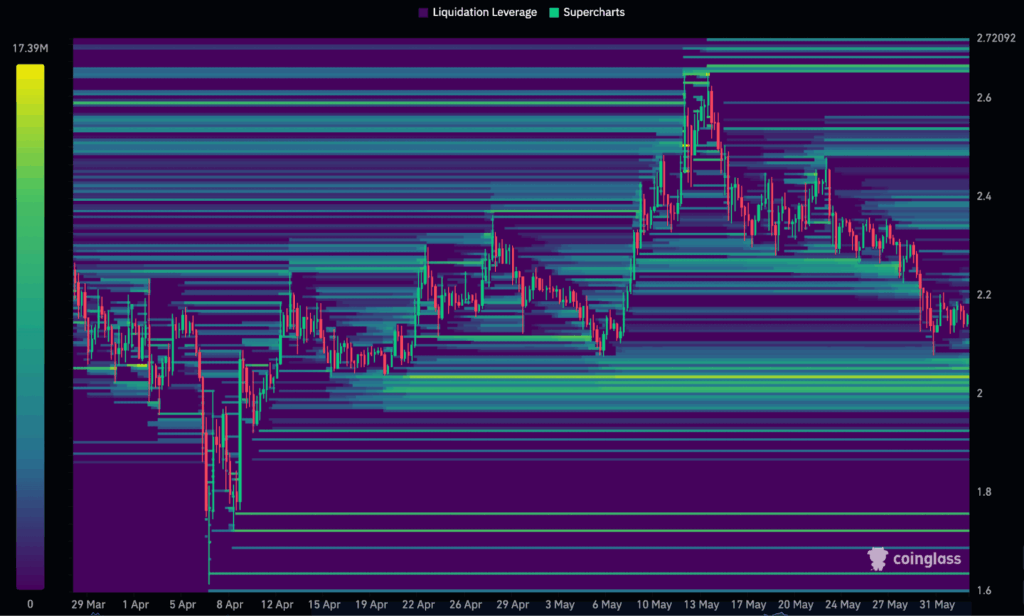
XRP price has repeatedly tested this support in recent weeks. Each bounce has shown progressively weaker strength.
The higher the frequency of testing of a level, the more fragile that level is. That makes a breakdown more likely on the next attempt, especially under macro or news-driven pressure.
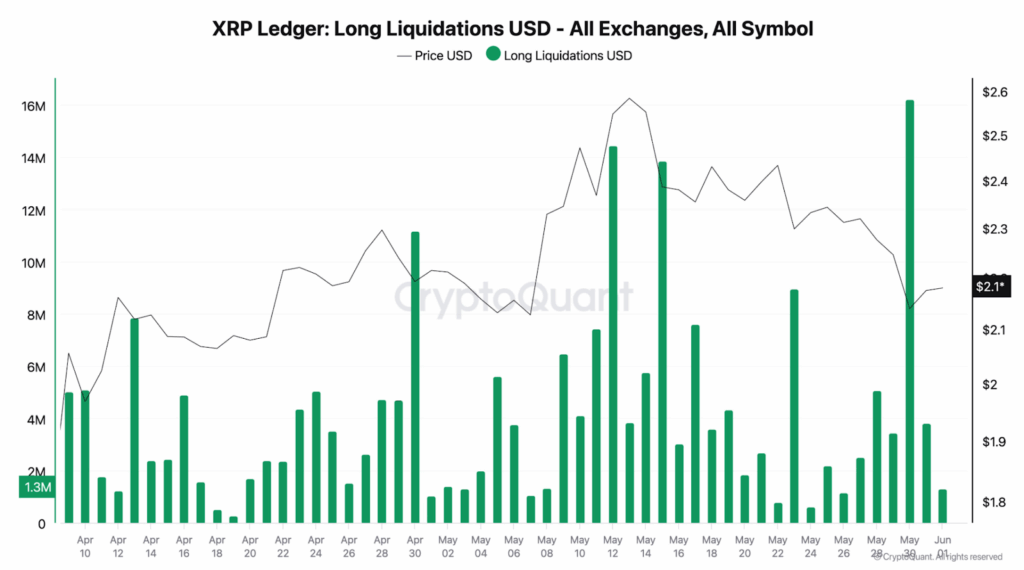
Recent data also shows long liquidations spiking aggressively throughout May and early June. Analysis by CryptoQuant confirms forced selling exceeded $15 million in one day. Perhaps these repeated events are the signs of a long-side shakeout coming to an end.
Technical Structure and Catalysts Remain Mixed
From a macro chart structure perspective, XRP still follows a long-term ascending channel, and price is approaching historical support zones. Technical projections suggest rebounds if the $2.00 zone holds.
Additional support is also from the intersection of the 21-week EMA and macro trendline, near current levels.
Long-term fundamentals are improving, but short-term sentiment remains cautious. Real-world utility is strengthened with Ripple’s recent addition of a major payment integration with Portuguese FX agency Unicâmbio. After volatility cools, such developments could help price stabilize.
Another layer of interest is added by speculation around a potential BlackRock XRP ETF filing. While not confirmed, talk is underway, which could quickly change institutional sentiment. Confirmation could halt further downside, and ETF-related news tends to be market-moving.
From a supply side, XRP is capped by the 55 billion tokens in escrow, preventing inflation. This allows XRP’s long-term structure to be predictable by this supply control. Growing derivatives activity gives XRP both speculative potential and structured fundamentals.
Now the market is watching if XRP can hold $2 or needs a deeper flush to reset leverage. Volatility could spike if it breaks below support as liquidation levels trigger consecutively. But if support holds, a relief rally could ensue with shorts the next target.


