Key Insights:
- Toncoin OI hits $190M in 24 hours, signaling aggressive long positioning.
- Over 1.2M addresses hold TON around $3.24, forming a strong demand zone.
- Active addresses hit 1.9M as TON enters top 10 most-used L1 chains.
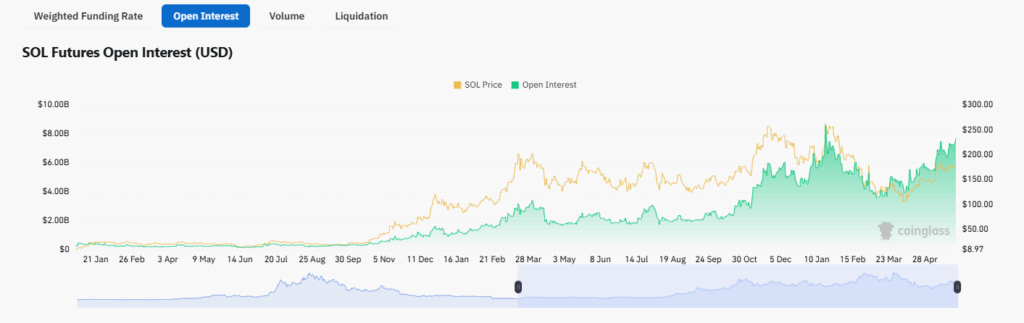
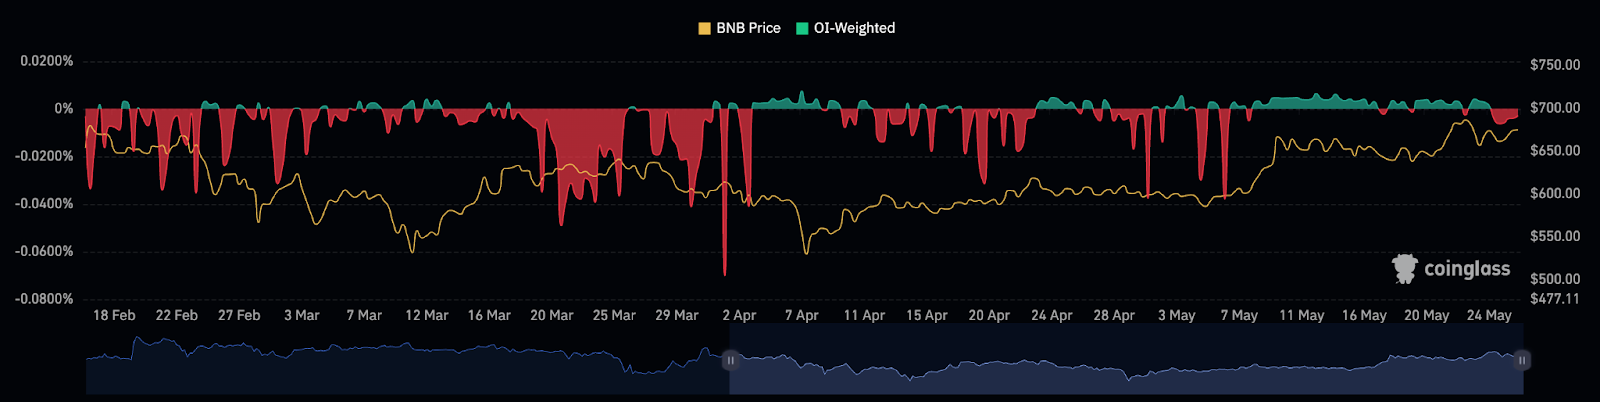
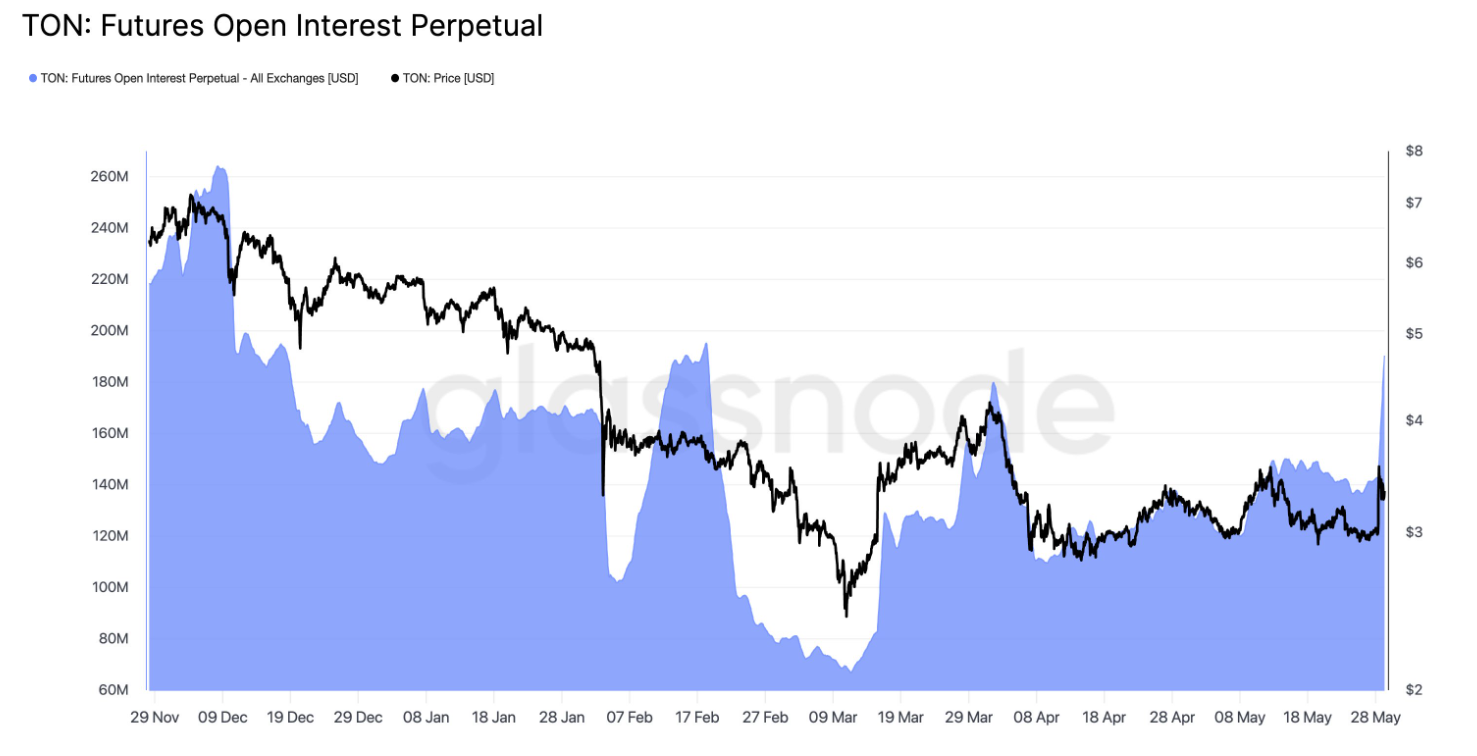
In just 24 hours, Toncoin (TON) saw its perpetual futures open interest skyrocket by 33% from $143 million to $190 million. This is the highest level since mid-February and shows the market is aggressively positioned as speculative activity rises.
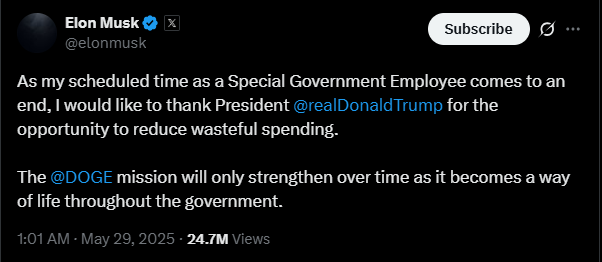
Meanwhile, TON price remained steady at around $3.29 amid confusion surrounding a reported AI partnership between Telegram and xAI. Elon Musk denied finalizing a deal, causing short-term volatility. However, futures interest stayed high, signaling bullish sentiment remains strong.
Toncoin Sees Surge in Open Interest Amid Market Speculation
The 33% jump in the open interest of Toncoin in one day shows growing speculative interest across derivatives markets. Glassnode data shows total open interest increased to $190 million, its highest since February 18.
Despite TON’s spot price hovering around $3.29, trading activity showed strong speculation. The spike indicates traders were leveraging positions, anticipating a breakout.
Market excitement surged after Telegram founder Pavel Durov announced a partnership with Elon Musk’s xAI. Grok’s integration with Telegram fueled enthusiasm.
Musk denied a signed deal, but the momentum continued. Traders kept investing in Toncoin as open interest increased.
Key Support Zone Holds as On-Chain Metrics Confirm Strength
Sentio on-chain data shows strong buying interest in the $3.19–$3.29 range. Around 1.21 million wallets have accumulated 739 million TON tokens.
This creates a strong support base and demand are that strengthens the bullish structure despite conflicting headlines. This group is in profit with an average entry price of $3.24.
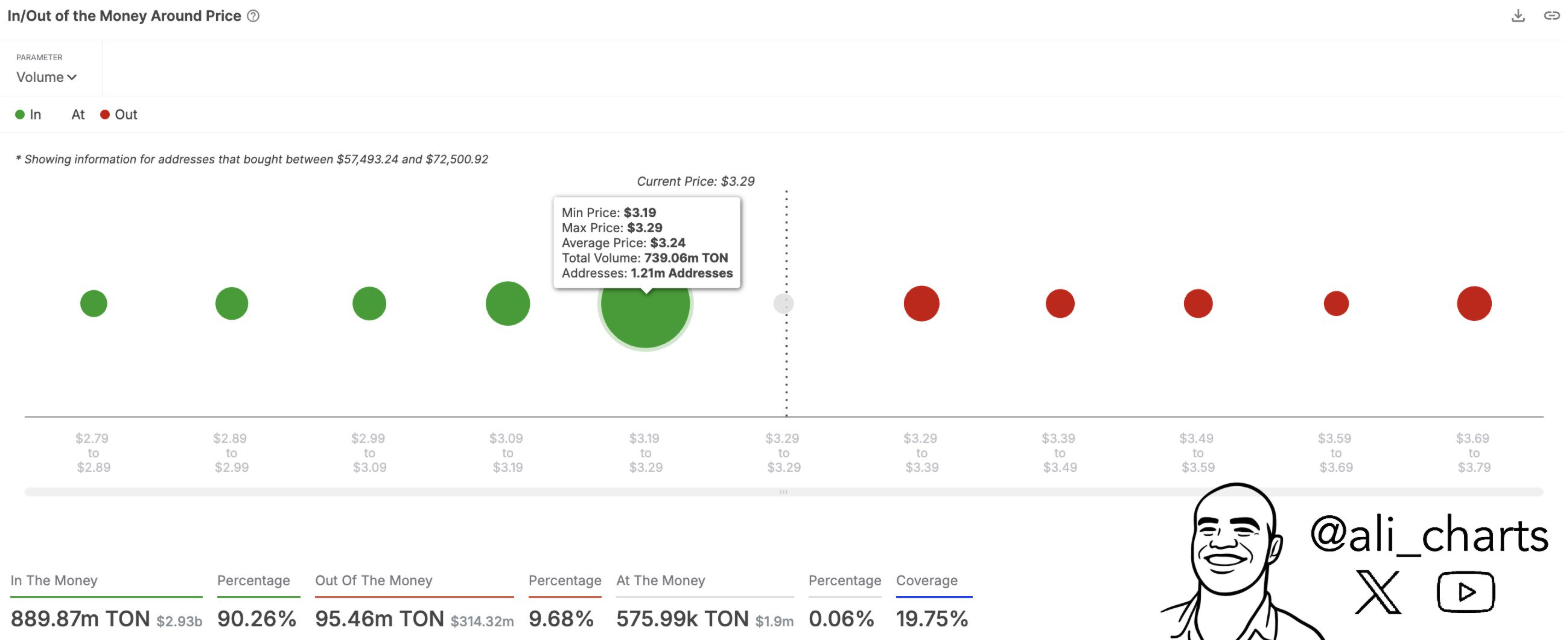
Currently, 90.26% of Toncoin addresses are “in the money,” and there is little pressure for profit taking. The current price stability and reduced selling risk is supported by only 9.68% of addresses being underwater.
This wallet distribution is a positive technical setup, especially if the token can break above short-term resistance near $4.84.
Technical analysts also say a bullish market structure has developed over the past months. Momentum could continue building as higher highs and strong rebounds from demand zones suggest.
Toncoin Ecosystem Growth and User Activity Support Momentum
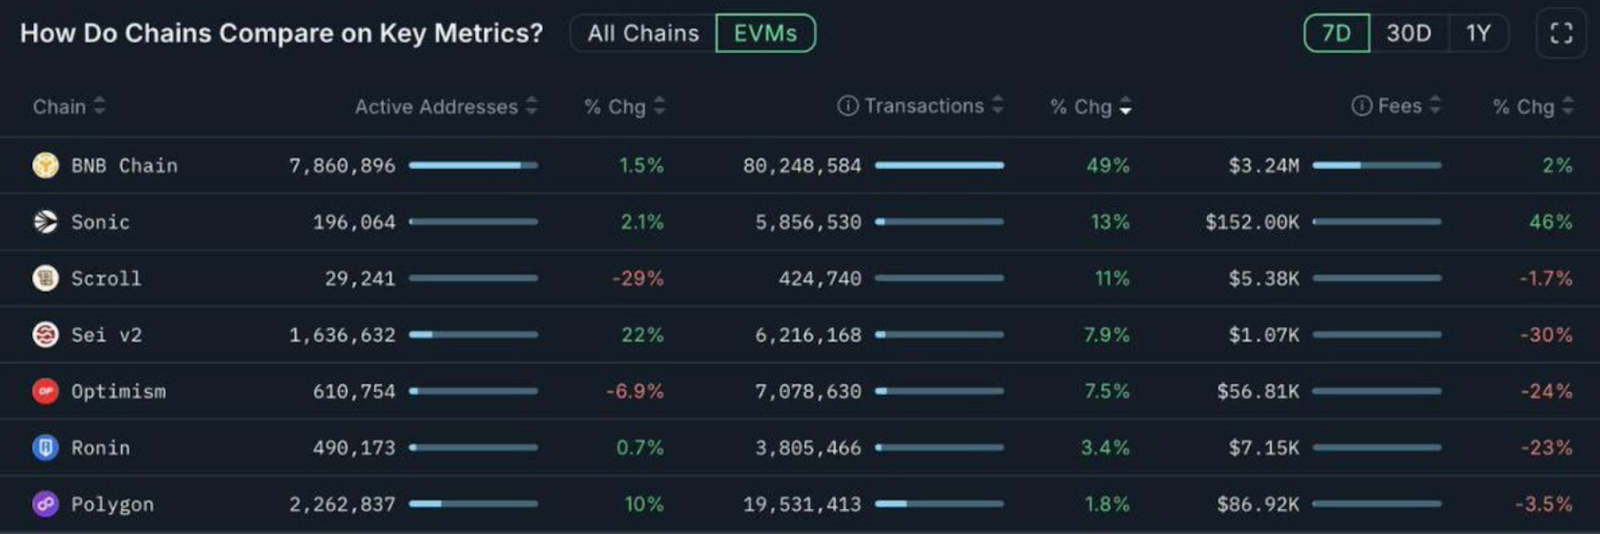
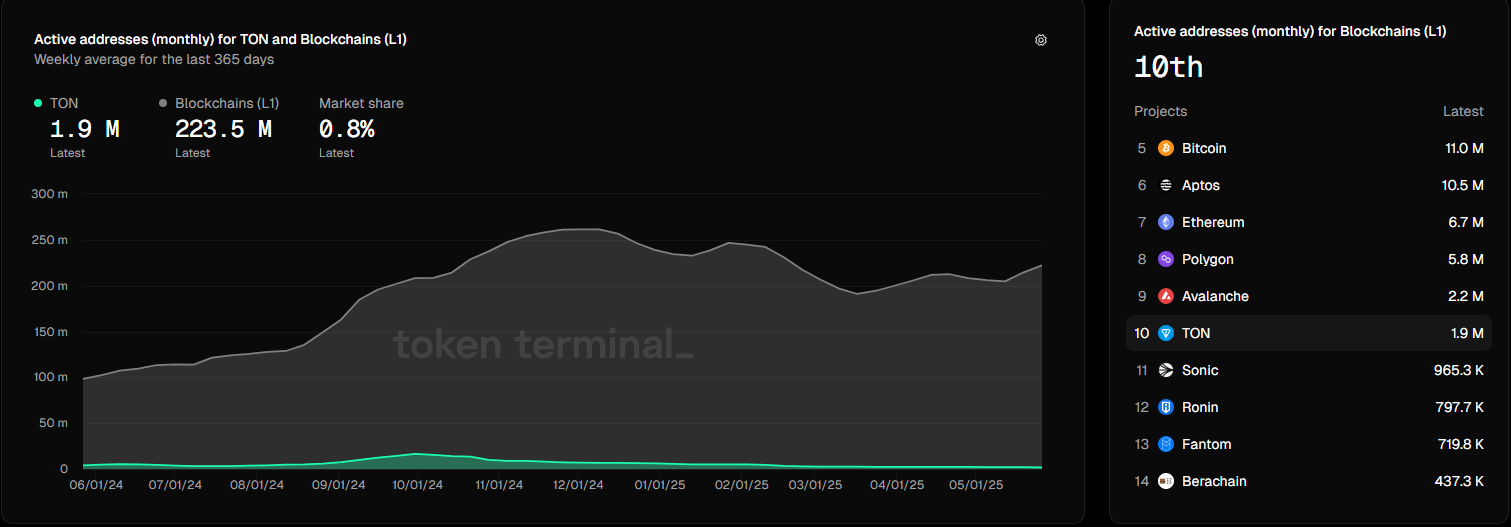
Furthermore, Toncoin’s ecosystem shows real signs of adoption, beyond speculative flows. Token Terminal data ranks TON 10th among all Layer 1 blockchains.
It has 1.9 million active monthly addresses. This means it has a 0.8% share of the wider L1 market and growing user engagement.
The Toncoin network benefits from its strong connection to Telegram. With 900 million users and 15 million paying subscribers, it can leverage this massive audience.
This infrastructure allows TON-based features like payments, wallets, and dApps to be directly distributed on Telegram. These integrations make TON a blockchain with immediate utility, not just speculative appeal.
TON is making strategic moves to scale its platform. It has appointed former Visa crypto executive Nikola Plecas to lead payment initiatives. The network also raised $1.5 billion in a bond raise. Backed by BlackRock and Citadel, this funding allows Toncoin to expand without token sales.
TON’s partnership with xAI remains uncertain, but trader optimism is strong. Open interest levels and on-chain activity show signs of increasing momentum.
Speculative leverage remains high as key price zones hold steady. Toncoin has become one of the most closely watched assets in the crypto market.