
Key Insights
- Pepe price prediction is approaching a major support of $0.00001300 that might form an H&S pattern, while key resistance is found at $0.00001550.
- The slight move towards bullish funding indicates that traders are still unsure how the market will move.
- The price level has moved lower than recent records without showing a significant increase yet.
PEPE, valued at $0.00001309 as of press time, has dropped by 12.82% in the past day.
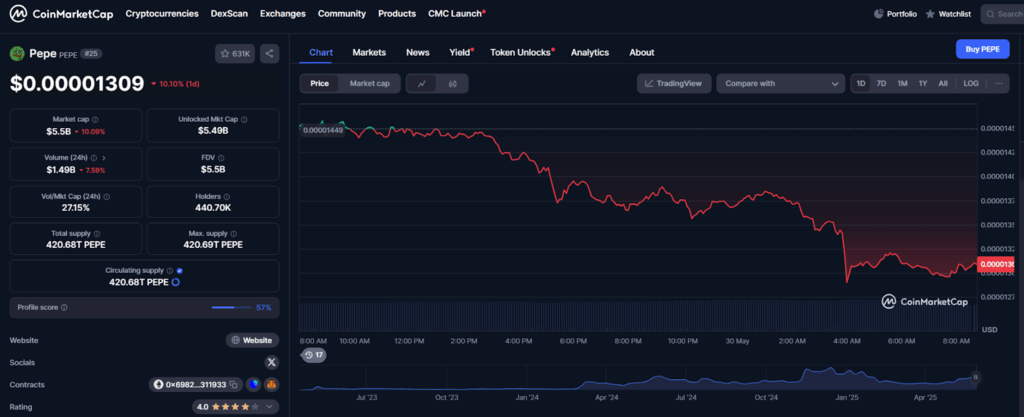
With a high trading volume of $1.49 billion, the total market cap of the asset is just 27.15%, suggesting a lot of stimulated market participation.
Pepe Price Prediction Behavior and Technical Setup
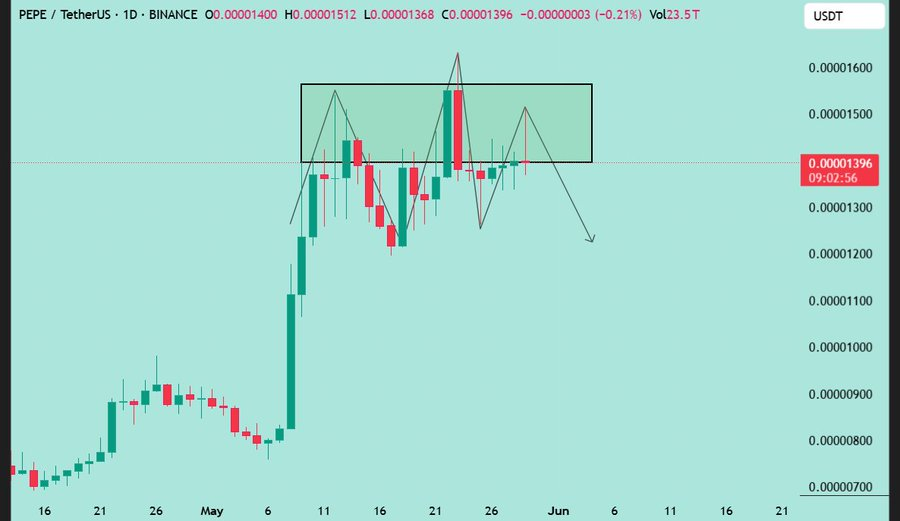
The price of PEPE seems to have remained between $0.00001300 and $0.00001550 for some time. In the daily chart, we can see that an H&S pattern may develop, with its “head” at $0.00001550 and two “shoulders” at $0.00001450. The $0.00001300 area which is currently a key support, can be found at the neckline in this pattern.
The neckline is tested daily by candlesticks which means traders are uncertain about the path the market will take. At the time of writing, the coin was trading at $0.00001396, above the neckline, as the market is not sure about going down or up.
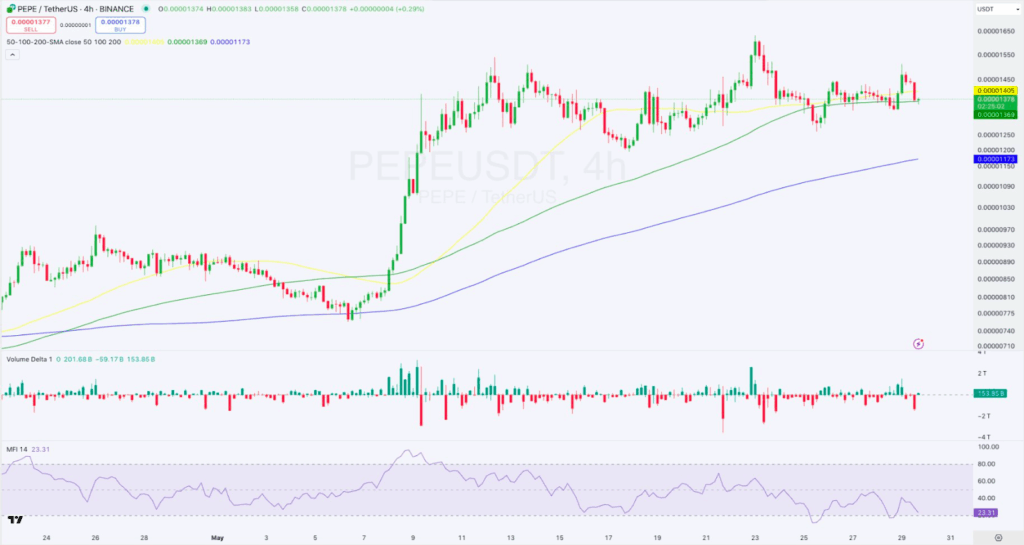
The four-hour chart also displays conflicting signals on momentum. The 50-, 100- and 200-period Simple Moving Averages (SMA) are clustered very closely together near $0.00001173 and $0.00001405, revealing a period of consolidation.
At 23.31, the MFI reading on the four-hour chart means that the asset is not oversold anymore. However, the asset’s price action has still not recovered strongly.
Interest in the futures market is on the rise, even though opinions on its direction are contradictory. A vast majority of Open Interest in PEPE futures is held on Gate.io at $332.43 million, Bitget at $128.33 million, OKX at $85.28 million, MEXC at $60.12 million and Bitunix at $52.73 million.
Funding rates for OI have swapped from being below zero in March and April to being above zero from early May. As a result, long positions are covering the short losses which is a normal symptom of bullish trading sentiment.
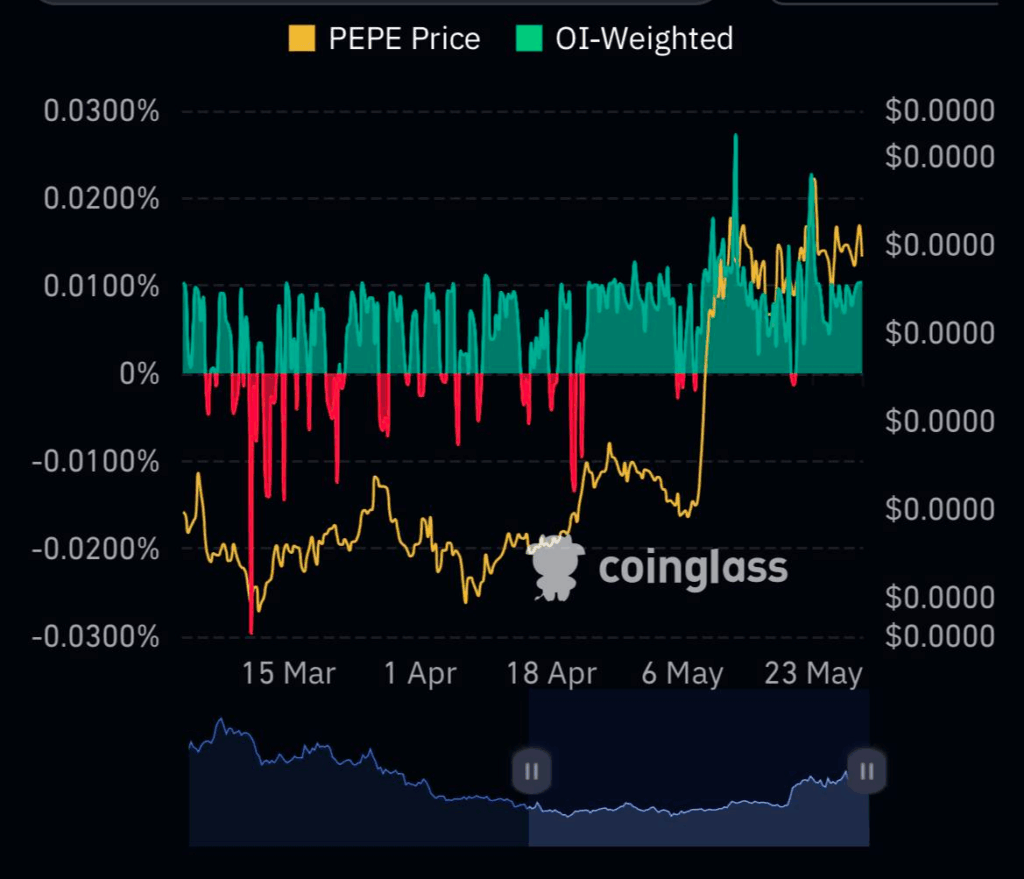
Recently, the funding rate has been around 0.01% which proves that the futures markets are carefully balanced.
Volume and Pepe Price Prediction Correlations
Although the daily trading volume declined by 7.59% severely from the earlier day’s figure, it continues to show a good volume-to-market cap ratio of 27.15%. Continued trading interest is represented by a high trading volume.
Yet, in the past 24 hours, the value of Dogecoin has fallen from its recent top of $0.00001449 to $0.00001309. Around early morning, the token experienced its biggest loss and the CoinMarketCap chart reflects that it did not return to its last high.
Looking at the daily chart from Binance, you can see a rectangular region in which prices repeatedly encounter resistance and support levels.
Should the price go below the neckline, the pattern may be completed as outlined in the annotations. If it happens, the amount of downside for the token might be $0.00001200 or less.
If the price doesn’t fall below the neckline, it could reveal more sideways movement or allow prices to surge to new highs above $0.00001550. The confirmation of a trend will depend on the results shown by volume and momentum indicators.