
Key Insights:
- Pi crypto trading volume surged 47.79%, confirming growing accumulation interest.
- Price action forms a falling wedge, signaling a bullish breakout setup.
- Stochastic RSI and AO align, indicating short-term bullish reversal.
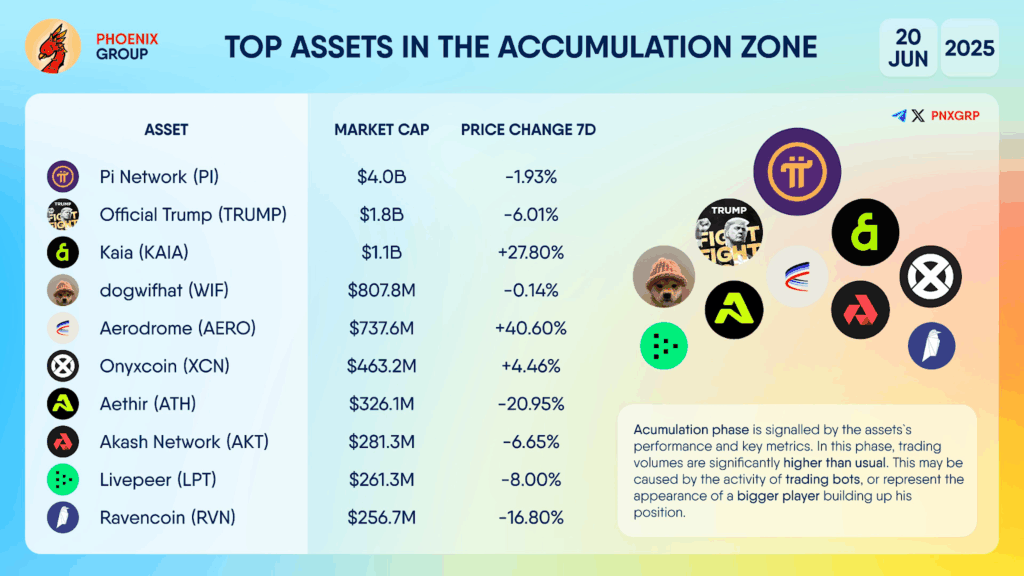
Pi crypto ($PI) has entered a critical phase of market activity, indicating that it is in the accumulation zone. Over the past week, Pi crypto has experienced a slight decrease of 1.93% in price but managed slight gains for the day. This reflects moderate price action.
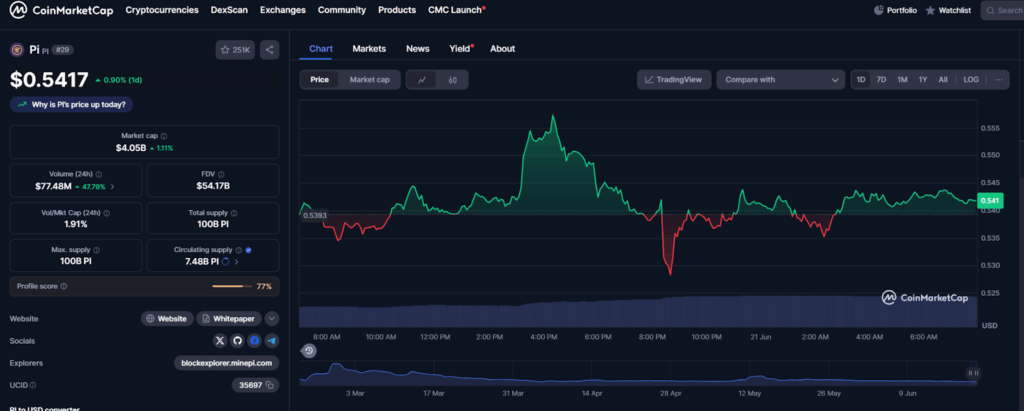
However, its trading volume has increased significantly, suggesting heightened interest from market participants, particularly in the accumulation phase. Pi Network has experienced an incredible 47.79% growth in trade volume over the last 24 hours, to stand at $77.48 million as of press time. The value has recently exceeded and maintained the $0.54 mark.
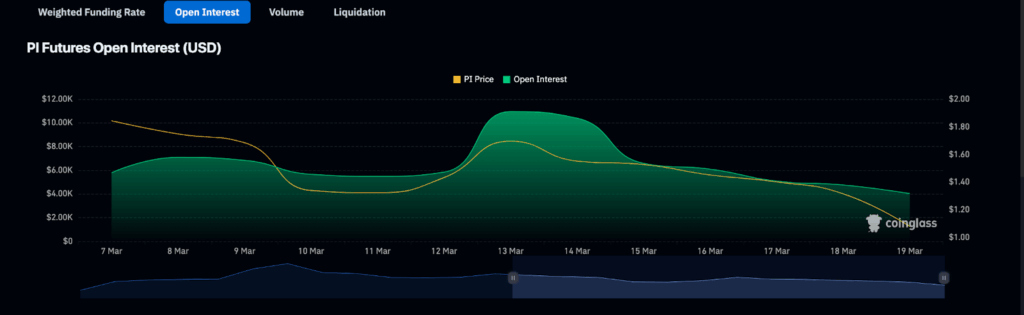
Examples of recent data, examined on Futures Open Interest (USD) at the beginning and middle of March, give us reason to think that there was a significant gap between the market participation and the direction of the price movement.
Pi Crypto Open Interest and Price Correlation Signals Waning Speculation
Open interest began to increase gradually in the range of $6K until March 7 and then escalated to around $10K on March 14. This is concomitant with the temporary recovery of the price of Pi from the mid-level of the $1.60s to the low-level of the 1.80s mark. This escalation of open interest showed that there was an increase in speculative activities. That was probably occasioned by enthusiasm concerning the future ecosystem protocol.
However, as the trend continued, price and open interest started to fall together by March 15. The cost of Pi dropped significantly, decreasing by approximately half to near $1.10 by March 19, as the volume of open interest was gradually being squeezed. Such coordinated downside leaves the notion that market players are embarking on exiting positions due to diminished confidence or momentum based on an event.
As the data shows, speculative excitement dropped ahead of the second half of March, and open interest returned to the March 7 baseline. This contraction indicates a temporary stabilization period unless new catalysts or technical breakthroughs break out to activity. Pi is trading less confidently and has diminished exposure to futures until this point.
Pi Network Long-term Charts Show Breakout Potential
Pi Network (PI/USDT) is at a critical point in the market since the price is being squeezed into a wedge pattern. The 12-hour chart shows such a formation, which shows a stable presence of bearish pressure over the last month, but with increasingly insignificant bearish force.
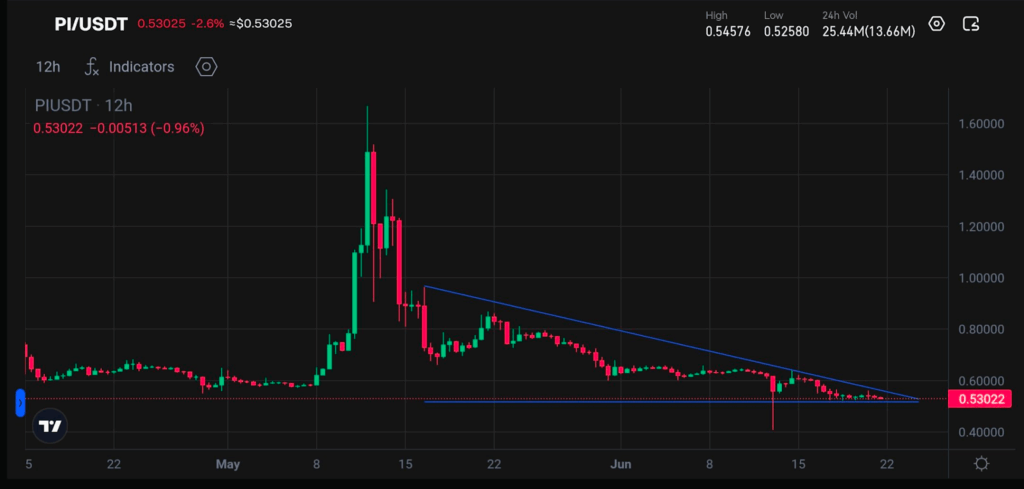
The resistance line is inclined downwards, and the support is flat at around $0.52-0.53, forming a falling wedge shape as taught in textbooks. When the price reaches the higher end of the wedge, we anticipate an upside break.
Short-term Charts Back Breakout Potential
The 4-hour chart indicates a bearish parallel channel, which has recently broken upwards. This breakout is in line with the lower limit of the wedge pattern explained earlier. The 4-hour chart Awesome Oscillator (AO) represents a bearish crossover by indicating how red histogram bars change into green bars, an apparent indication of a reversal of momentum.
Meanwhile, the Stochastic RSI is flowing out of the oversold zone and is now above the 80 mark. This means that there is increased short-term bullish momentum. All these indicators are pointing to the possibility of a reversal trend.
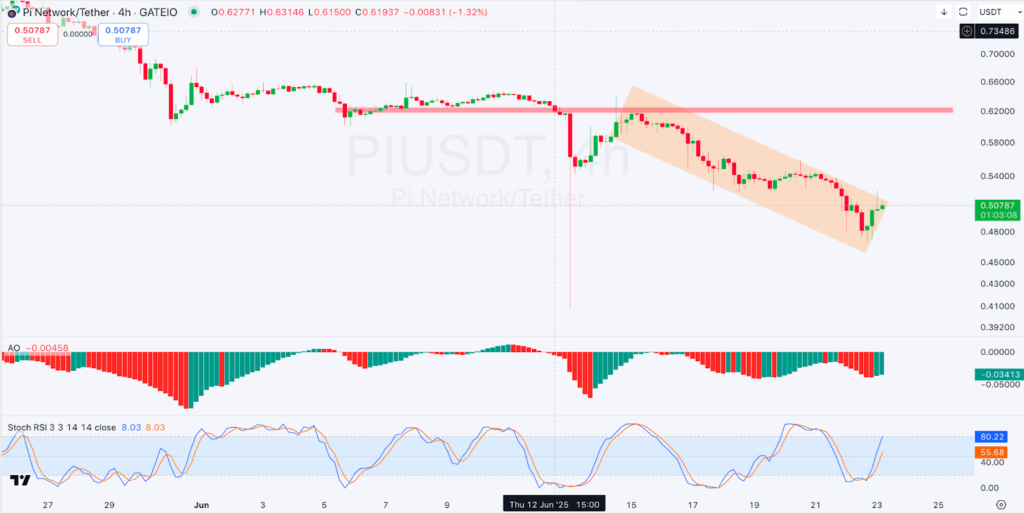
The most crucial resistance point to consider after the breakout would be around $0.60-$0.62. This is the support zone prior to the breakdown in early June. Going further, more optimistic targets indicate the psychological level of 1, a possible doubling of the current rates. However, this is only provided that momentum is maintained and the general situation in the market plays along.