
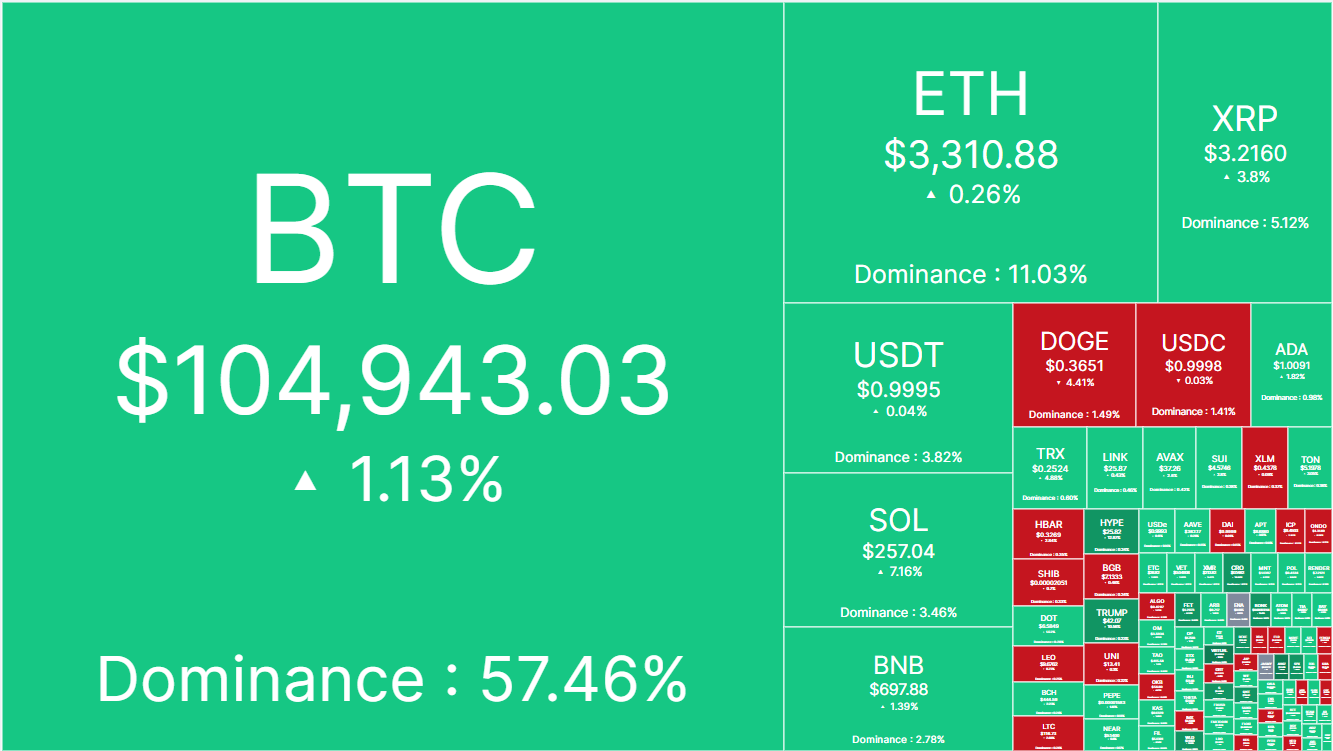
Key Insights
- The crypto market is now recovering after the post-inauguration slump from earlier this week.
- Bitcoin is making its way up from the $100,000 zone and is attempting to finalize its break above the $104,000 zone.
- A break above the $109,000 zone could lead to a high of $128,000 for Bitcoin.
- Ethereum is currently trending higher from the $3,125 zone and could be ready to hit the psychological $3,500 zone soon.
- XRP is attempting a break above $3.19, but also needs to clear the $3.47 price level to be considered fully bullish.
The price of Bitcoin hit a new high this week, just as US President Donald Trump took office as the 47th leader of the country.
The cryptocurrency took a step backwards towards the $100,000 mark soon after this event, and is now attempting to make its way upwards once again.
Bitcoin’s performance affected the general crypto market as expected, causing a decline late across the altcoin market as well on Monday.
As it stands, the crypto market is struggling to get back on its feet, and here’s what’s been going on with the three largest cryptocurrencies on the market:
Bitcoin, Ethereum and XRP in terms of price action.
Bitcoin Reattempts The $110,000 zone
According to Bitcoin’s price history, the cryptocurrency reacted to the Trump inauguration on Monday and hit a new all time high of $109,000.
Despite its decline towards the $101,000 zone soon after, trends in on-chain data show that the institutional investors jumped in on the dip, and have taken the opportunity to buy so close to the psychological $100,000 mark.
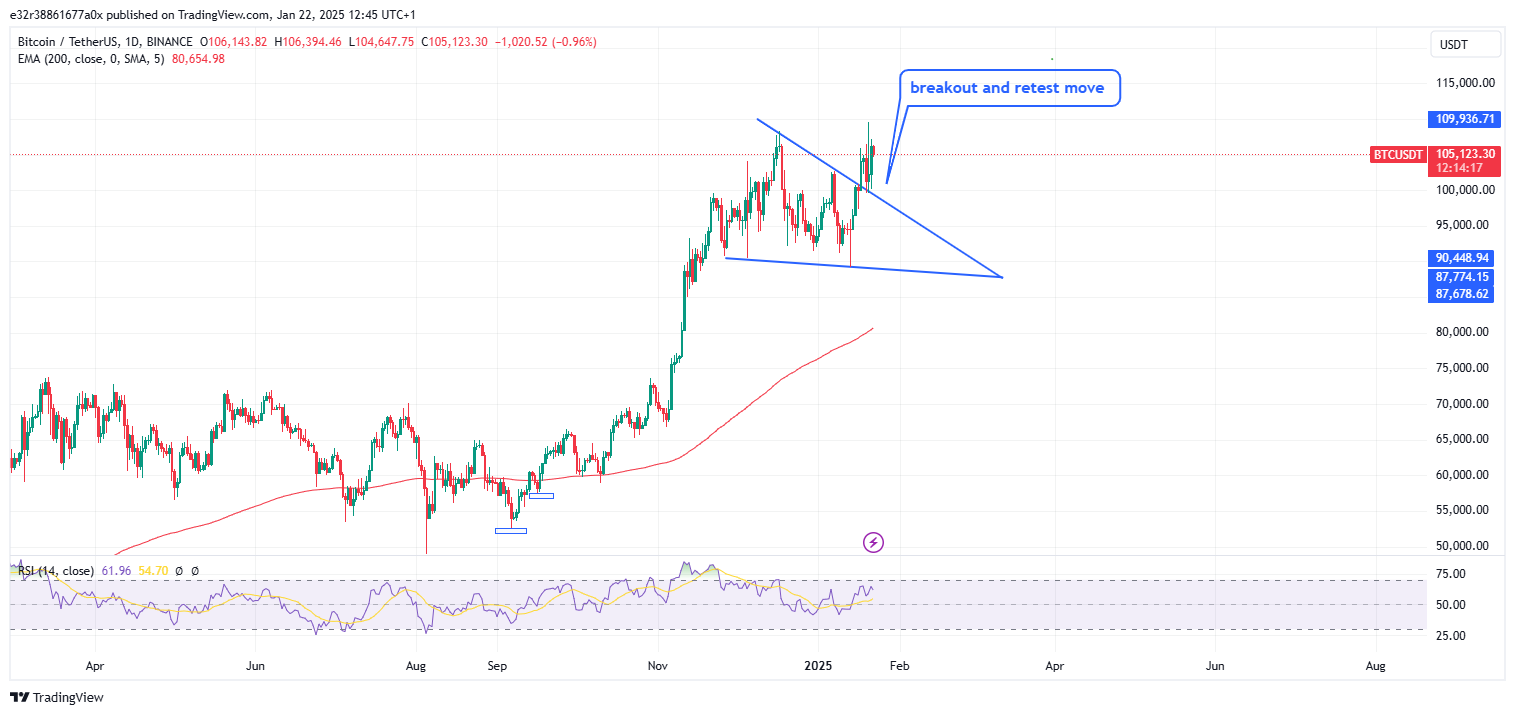
As indicated by the chart above, Bitcoin’s price explosion was brought on by its break out from the falling wedge as shown.
Its subsequent decline towards the $100,000 mark was a retest move after the breakout, and was a completely normal reaction.
The RSI on the daily chart show that the bulls are in control of prices, and that Bitcoin still has a lot of upside potential.
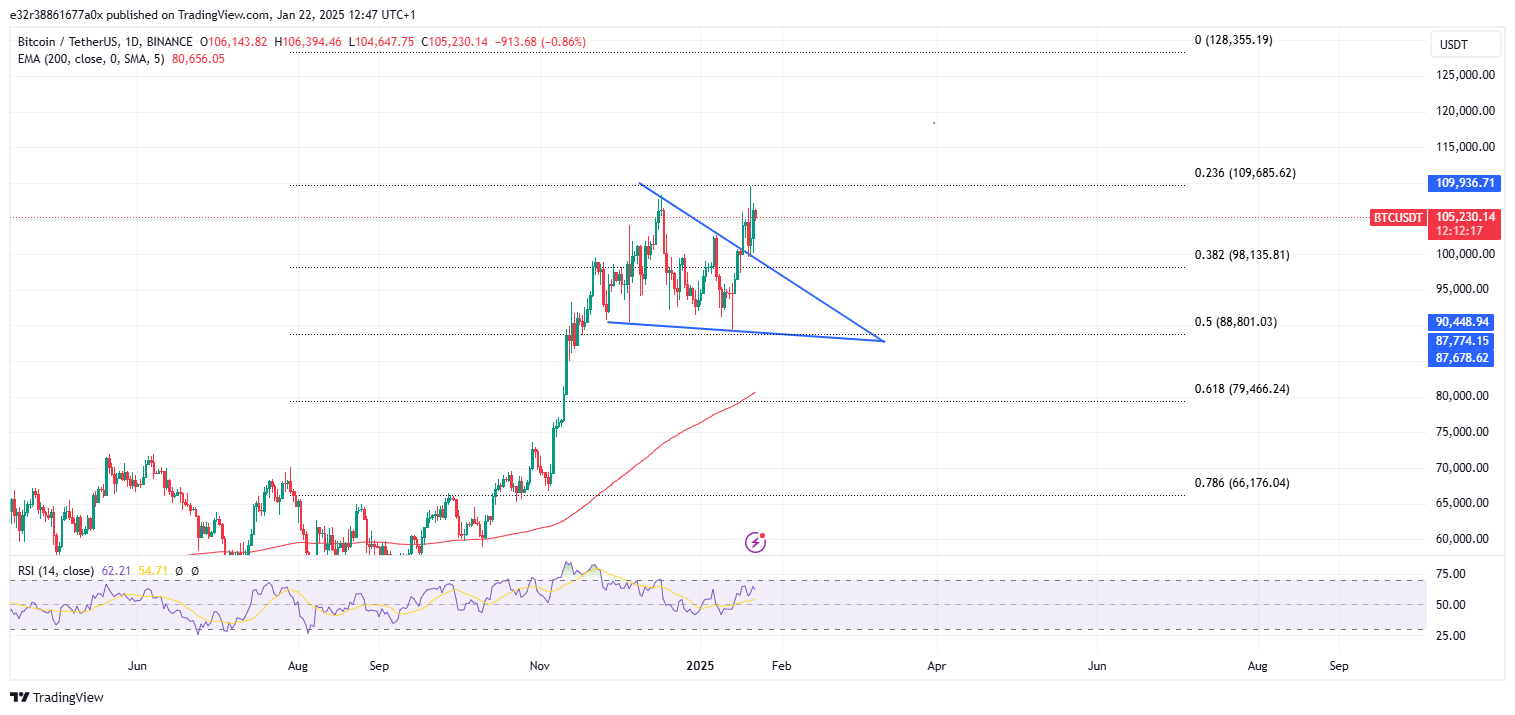
The cryptocurrency is also attempting to stabilize above the $104,000 price level and the Fibonacci extension tool shows that the major resistance to be aware of is the $109,000 price level that Bitcoin declined from this week.
The indicator also shows that a confirmed break above the $109,000 zone could lead to a push further upwards to $128,355.
Ethereum Is In Good Hands
According to data from CoinMarketCap, Ethereum trades at around $3,320.
This is encouraging, because It means that the cryptocurrency is far up from the immediate supports around $3,125 and the psychological $3,000 level.
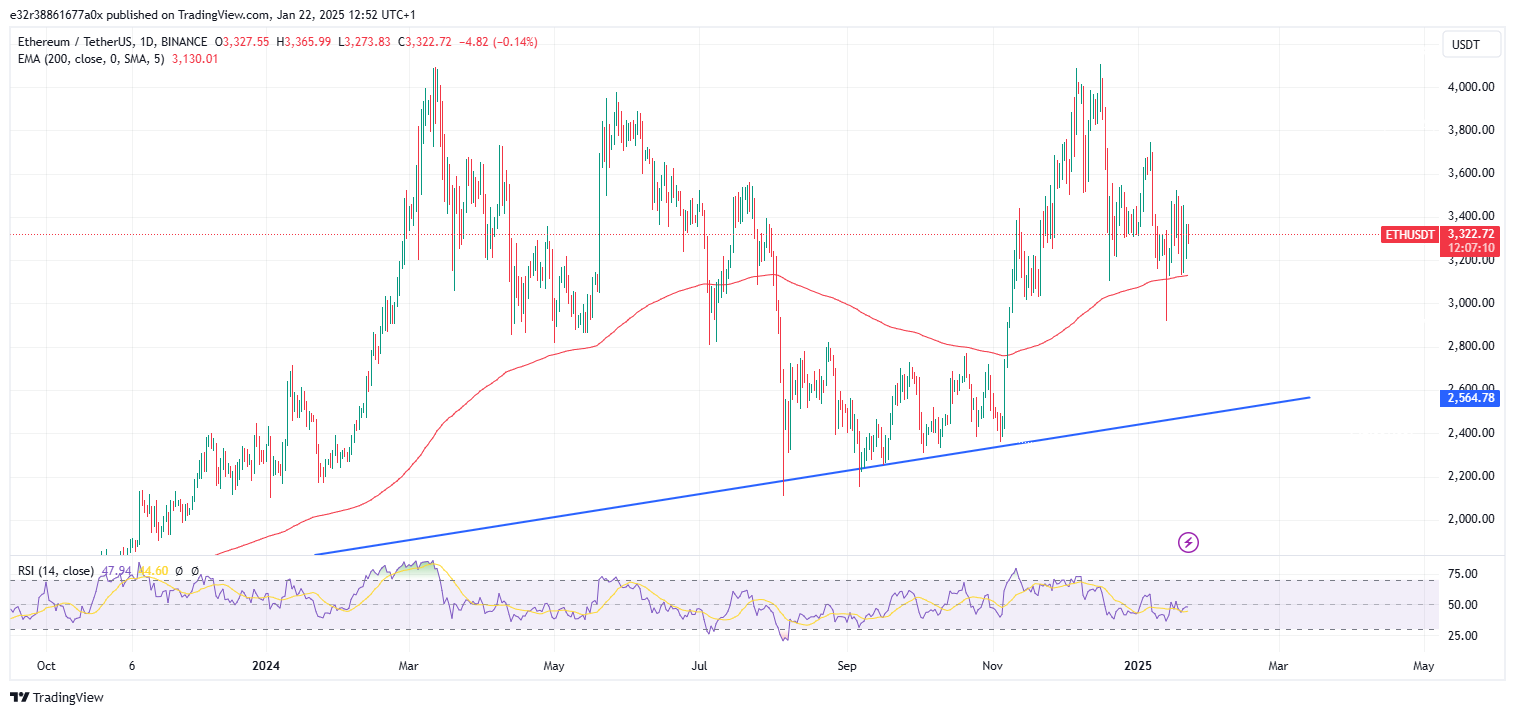
As shown by the charts, the 200-day EMA (red line) has been incredibly strong over the last few months, holding Ethereum up since November of last year.
Ethereum is now resting on top of this moving average (which sits at $3,125) and is leveraging it as a dynamic support.
With this in mind, Ethereum must keep from breaking below this price level, considering how steep drops have historically resulted from Ethereum breaking below the 200-day EMA.
As long as Ethereum keeps from breaking below this $3,125 price level, it is bound to continue further upwards and hit the psychological $3,500 zone—which could pave the way towards $4,000 and beyond.
Strong Upside Potential For XRP
So far, XRP has been particularly strong, especially with its ongoing recovery around the $3 mark.
The RSI on the daily chart shows that the cryptocurrency is trading in bullish territory, which is encouraging.
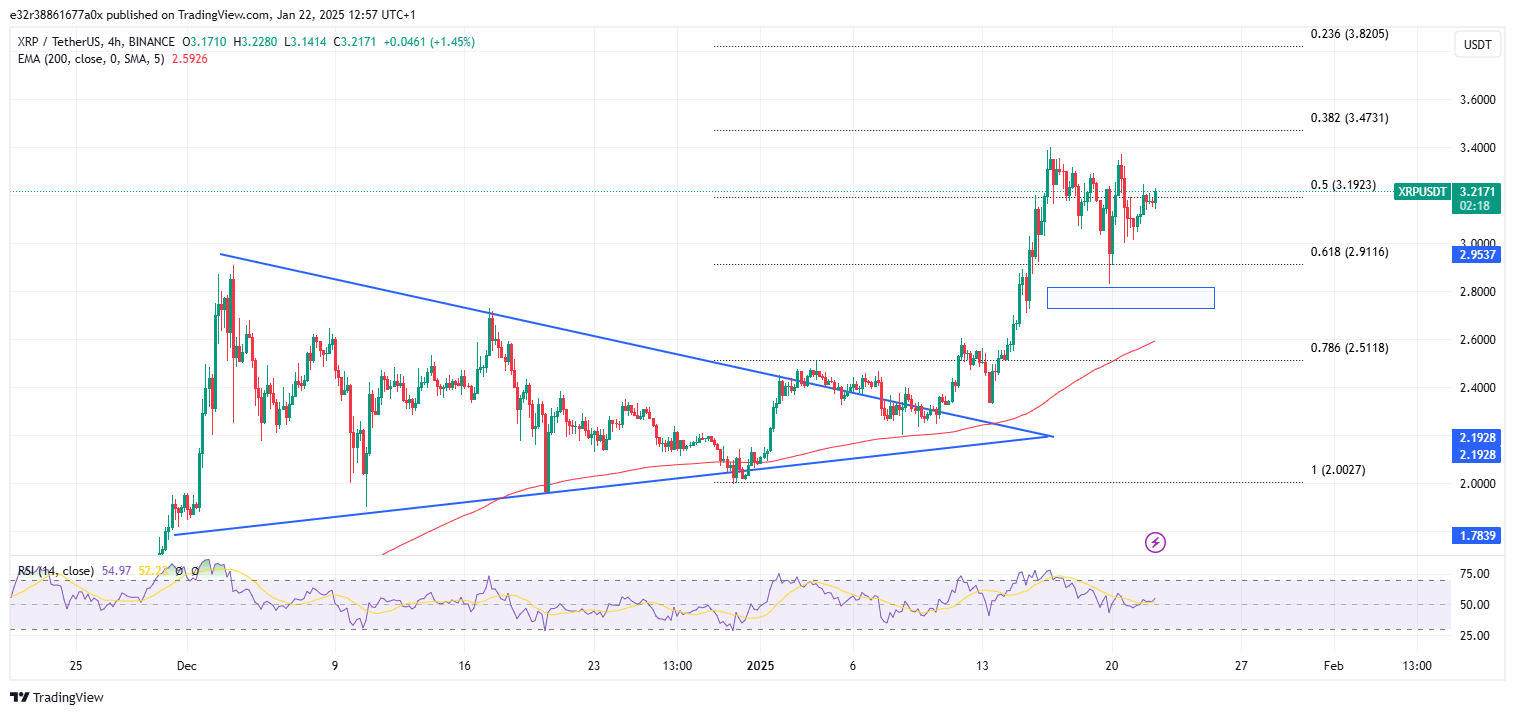
On the 4-hour chart, XRP is also making strong attempts to push further up from the $2.9 price level.
It is currently attempting to break above the $3.19 price level as marked out by the Fibonacci retracement tool, and could be looking at retests or even possible breakouts from the next resistances around $3.47, and $3.82.
With all of this said, XRP can only be considered fully back in bullish action if a break above the $3.47 zone occurs.
Bullish predictions for the cryptocurrency include targets anywhere between the $5 mark to $10.