
Key Insights:
- Shiba Inu price has dropped to $0.00001157, marking a 35% decline from its May high.
- The price fell below both the 50-day and 100-day Exponential Moving Averages, reflecting strong bearish pressure.
- Technical indicators show the Relative Strength Index nearing oversold levels while the Average Directional Index is rising.
Shiba Inu price extended its losing streak today, reaching its lowest level in over two months. The coin went down to 0.00001157, falling by 35 percent since its May peak. The fall notwithstanding, the chart patterns have indicated that the price may recover in the coming sessions.
The present trend suggests that bears are dominating the market, but the technical indicators provide a clue about an upcoming turnaround.
SHIB is testing a key support zone, which could lead to the formation of a double-bottom pattern. In the event that this technical setup happens, it could possibly result in a 70 percent price recovery.
In spite of the weak trading sentiment, a number of trading indicators are starting to indicate early recovery.
Price reversals usually occur after an increase in funding rate and a reduction in open interest. Thus, investors are watching for some form of bullish breakout.
Shiba Inu Price Extends Losses but Shows Double-Bottom Potential
The Shiba Inu price has now slipped below both the 50-day and 100-day Exponential Moving Averages, reinforcing the ongoing bearish sentiment.
This action proves that sellers are in charge, as it has driven the price down to a new low since April 9. The chart, however, indicates a potential base building.
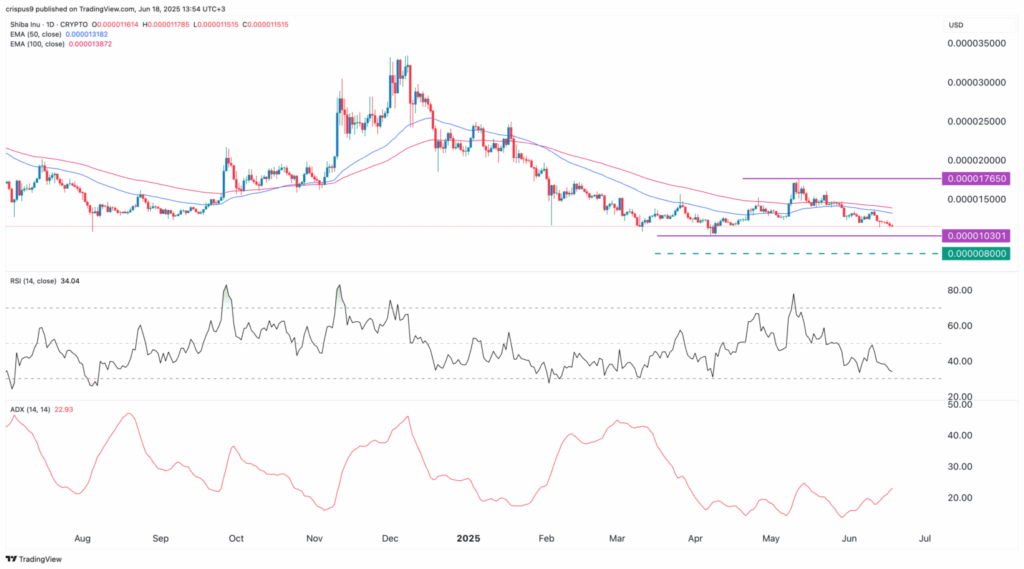
The Relative Strength Index is pointing downwards, and it is near the oversold situation of 30 levels. The other technical indicators are providing mixed signals.
In the middle, the Average Directional Index is increasing, which proves that the current downward trend is strong. All these trends indicate that more negative developments are to be expected before a significant recovery.
Still, the Shiba Inu price is forming a rare double-bottom pattern, with support sitting at $0.00001030.
Such a W-shaped pattern can be created when the price touches the same support twice and bounces back. So, the neckline will be at 0.00001765 when it is full, which is roughly 70% higher than the bottom.
Open Interest Drops While Funding Rates Rise
Shiba Inu’s price has been falling alongside its future Open Interest (OI), which has dropped sharply in recent weeks.
This amount of open interest is the lowest since April, or $134 million. Earlier, it touched the mark of $272 million, indicating less appetite among futures dealers.
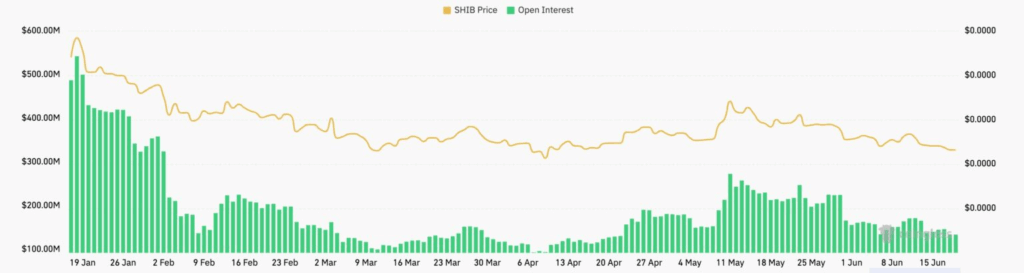
A decrease in open interest generally means that traders are liquidating positions, and it is a good indicator that the trend may be exhausting.
In most instances, this kind of decrease is followed by a bullish flip in the asset’s price. Therefore, this trend may support a rebound in the Shiba Inu price if other conditions align.
The coin’s weighted funding rate, on the other hand, has become positive in recent days, which signals the increasing positivity of the long-position holders.
A positive funding rate indicates that the buyers are ready to pay a premium in the long position. This will change the sentiment, hence the uptrend from here.
Shiba Inu Price Forecast Hints at Rebound but Bears Still Active
Shiba Inu price is expected to revisit the $0.00001030 level, which acts as the base of the double-bottom structure. This level is likely to sustain, and with the pattern being complete, the price can increase up to the neckline at $0.00001765. That would translate into a 70 percent appreciation on the bottom levels.
However, the bullish view will be nullified if the price dips below the support. The second point of support in such a situation would be approximately at the value of $0.0000080, and this is a crucial area that was previously identified earlier this year. In this case, it would indicate that there would be prolonged losses in the short run.
Despite recent whale capitulation and a decline in Shiba Inu’s burn rate, some technical signs now suggest a potential recovery. Other meme coins have made many of the investors divert their attention; however, the new double-bottom formation still leaves the possibility of a rebound alive.