
Key Insights:
- Cardano price is testing a critical demand zone between $0.63 and $0.66 following rejection from the $0.76 resistance.
- Analysts show ADA trading below key EMAs, indicating continued bearish momentum in Cardano price prediction.
- Long-term support trendline remains intact, but a breakdown may push Cardano toward the $0.30 extension level.
Cardano price prediction shows an unclear trend as the market slows. Technical analysts point out a mixed signal of possible bullish breakouts to bearish continuation patterns.
Cardano price remains near key support and resistance levels. Traders analyze chart structures and volume trends for insights. These patterns help predict short-term price movements.
Cardano Price Prediction Identifies Bullish Channel Structure
Crypto King maintains a bullish hope on the Cardano price prediction. The asset trades within an ascending channel, marked by two parallel yellow trendlines on the daily chart.
ADA coin has recently recovered after touching a low of $0.6186, and it is forming a series of higher highs and higher lows.
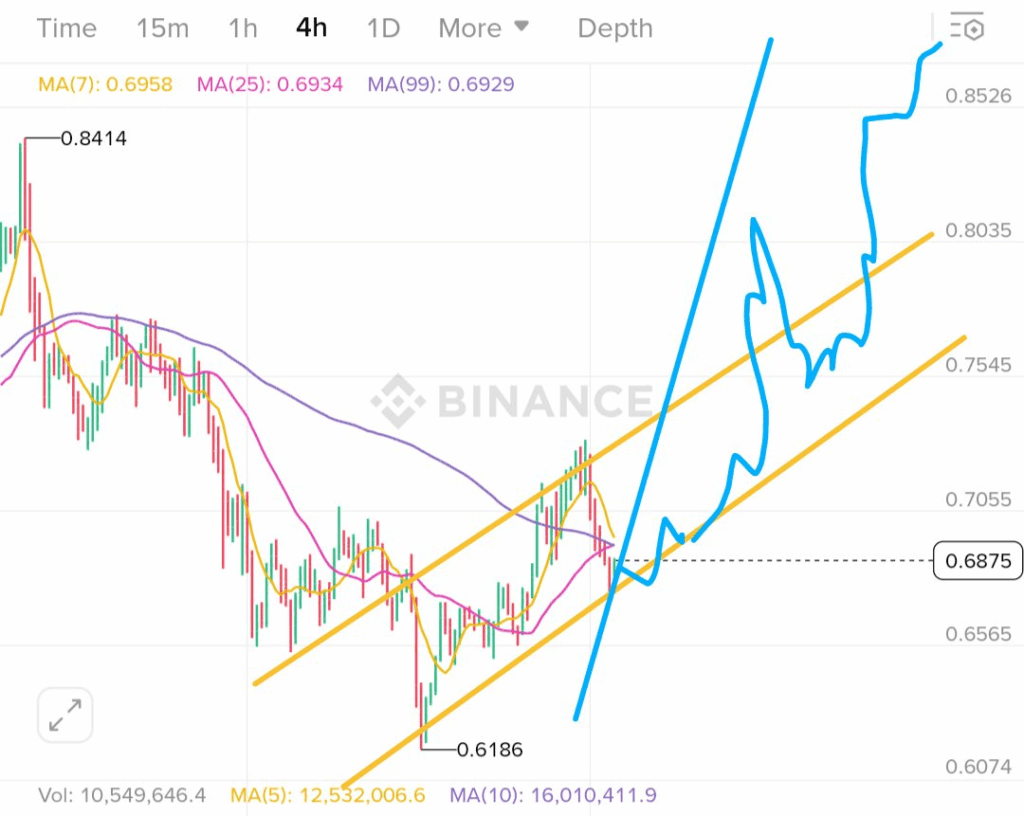
A hand-drawn blue projection line on the chart also anticipates an upward breakout. That will see Cardano price prediction break the $0.75 resistance area and approach the $0.80 and $0.85 regions.
More so, according to the analyst, a convergence of the 7-day, 25-day, and 99-day moving averages is a sign that heralds such a move. This technical state of affairs can be observed preceding high-momentum breakouts and indicates a potential upside pressure if the volume continues.
The analyst highlights stable action above the $0.65 support area and notes the historical respect of the channel’s lower boundary. The current setup, labelled a breakout retest pattern, could lead to a continuation rally should the channel remain intact.
ADA Price Consolidation Phase and Bearish EMA Signals
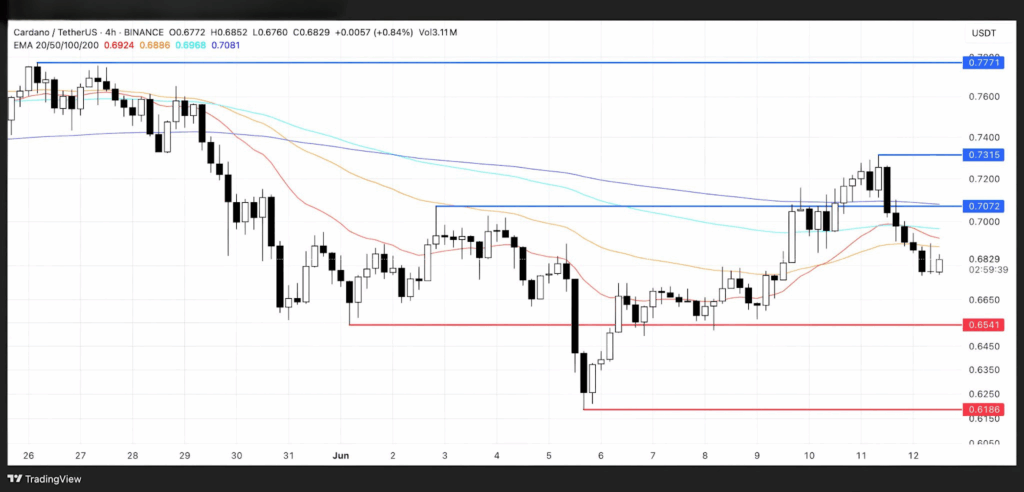
Technical analysis by TheDeFiGuru indicated a less optimistic picture based on the 4-hour timeframe. After rebounding from the $0.6186 level earlier this month, ADA entered a consolidation phase and failed to maintain upward momentum.
The coin trades below several key exponential moving averages (EMAs), an alignment associated with sustained bearish pressure.

Furthermore, the analyst notes a failed attempt to break above the 100 EMA. With this, the price reached $0.7315 before retreating below $0.7072.
This level has become a critical resistance zone, while support is $0.6541. Should this support break, the next downside target is $0.6186, representing a risk of nearly 8.6% from current levels.
According to the Cardano price prediction, price action remains range-bound between resistance at $0.7072 and support at $0.6541. This indecision is compounded by low trading volume and on-chain data showing declining whale wallet holdings.
ADA price prediction will continue trading sideways without a notable increase in buying activity or see further downside.
Analyst Cardano Price Prediction: ADA Risks Deeper Drop
Dan Gambardello offers a macro-level Cardano price prediction, suggesting significant bearish pressure on the daily chart. Cardano price has broken down from a long-standing consolidation channel between $0.63 and $0.76.
The 50-day and 200-day moving averages slope downward, reinforcing a bearish trend outlook. In addition, the chart includes liquidity metrics such as “Fed Net Liquidity” and “M2 Global Liquidity.”
This highlights how global monetary tightening has coincided with ADA price rejections from the $0.76–$0.78 resistance region. Cardano price prediction from this chart suggests that external economic factors currently weigh heavily on the asset’s performance.
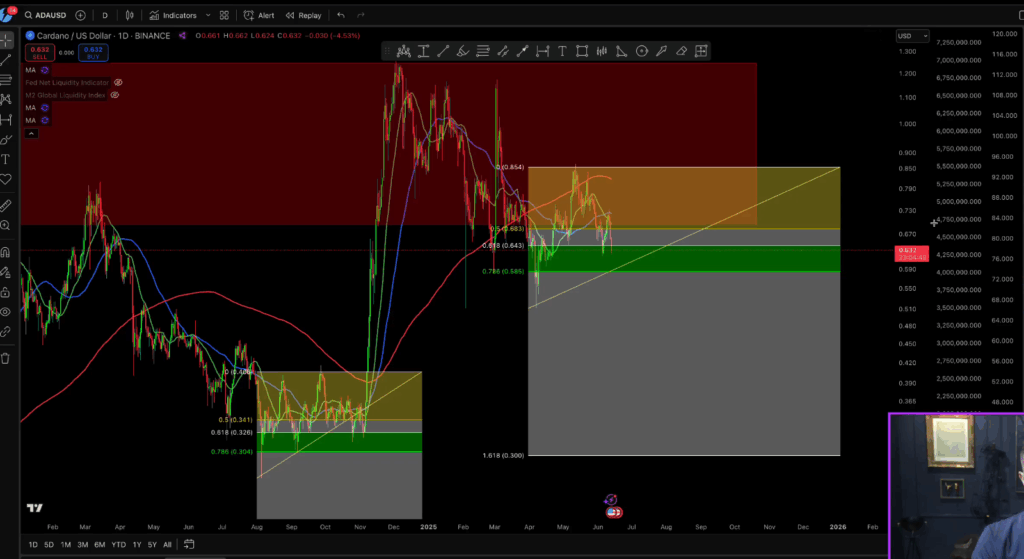
Fibonacci retracement levels are also in play, where ADA price has recently broken the 0.618 level at $0.684. It is heading towards the 0.786 level at $0.656.
If the price dips below this level, it could trigger a deeper correction. The 1.618 extension at $0.30 remains a possible target. Nevertheless, according to Gambardello, a medium-term growing trendline, starting in mid-2023, is still in place.
If the trendline holds as support and ADA reclaims the $0.684 level, further gains could be achievable. This could set the stage for a potential rise to the $0.76–$0.78 range within the broader recovery trend.