
Key Insights:
- XLM crypto price must hold above $0.2315 to preserve its bullish Elliott Wave structure on the daily chart.
- A breakout above the $0.2850 neckline may validate the double bottom with a $0.3179 XLM crypto price target.
- Volume concentration between $0.22 and $0.28 indicates sustained market interest in this accumulation range.
Several bullish patterns on the Stellar (XLM) crypto price predicting a directional breakout have been identified by analysts on different time frames.
XLM crypto is in the middle of a limited consolidation scope, and experts point to major support areas and reversal patterns.
Indicators and Key Support Signal XLM Crypto Price Reversal
According to technical analyst BigMike7335, XLM crypto price is forming a clear Elliott Wave sequence within a broader descending corrective channel.
The chart outlines a completed 5-wave microstructure, potentially signalling the end of wave ii. This level coincides with the descending triangle’s lower boundary, acting as a potential inflection point for a bullish impulse.
More so, $0.2315 XLM crypto price level aligns with a previously broken trendline serving as support, reinforcing its significance in the current market structure. As long as XLM crypto price maintains higher lows above this level, wave iii breakout is imminent.
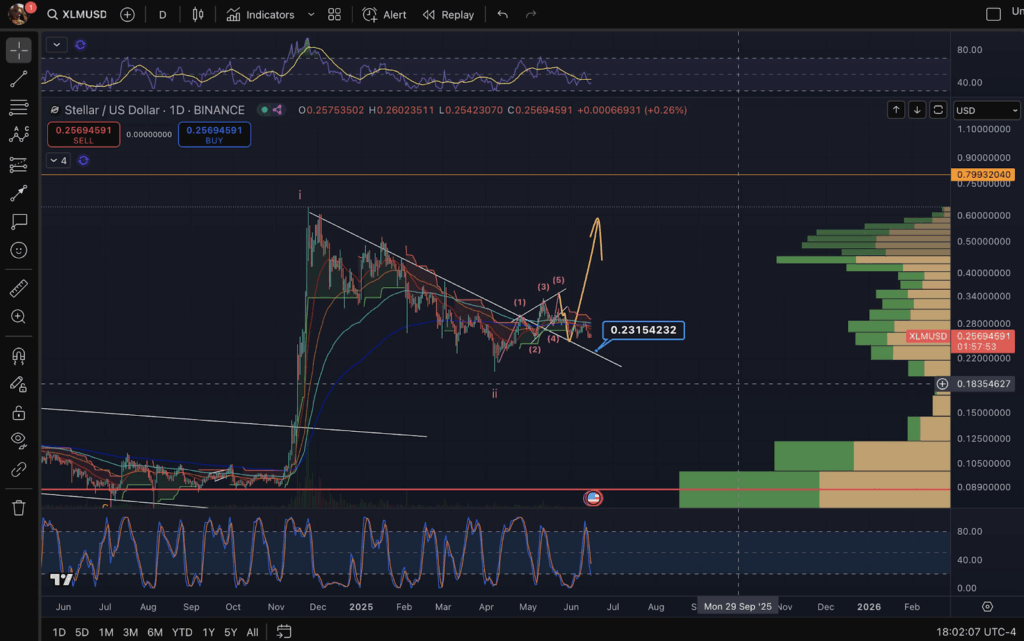
Further, the analyst identified $0.28 Stellar price as the neckline resistance whose breach would confirm a higher timeframe (HTF) wave 3 move. With a longer-term Stellar crypto forecast extending toward $0.799.
The analyst further pointed to the volume profile, which indicated concentrated accumulation in the $0.22 to $0.28 range.
A notable node appears around the current XLM crypto price of $0.2569, indicating strong historical interest in this area. This range is viewed as a base of demand that may offer critical support in the event of a retest.
On an indicator scale, the Stochastic RSI is coming out of oversold conditions, which implies that there are early signs of XLM crypto price momentum. In the meantime, the daily RSI is a flat neutral indicator above the 50 mark.
The analyst highlighted that these conditions are ideal regarding a bullish turnaround, but it has to be confirmed by a breakout of the resistance layer.
XLM Crypto Price Forms Double Bottom
Moreover, analyst Crypto Joe identified a Double Bottom reversal structure in XLM crypto price. The pattern features two distinct troughs near $0.2500, separated by a local high forming the neckline at approximately $0.2850.
This neckline area is acting as horizontal resistance and aligns closely with the 200-period moving average, adding further technical weight to the level.
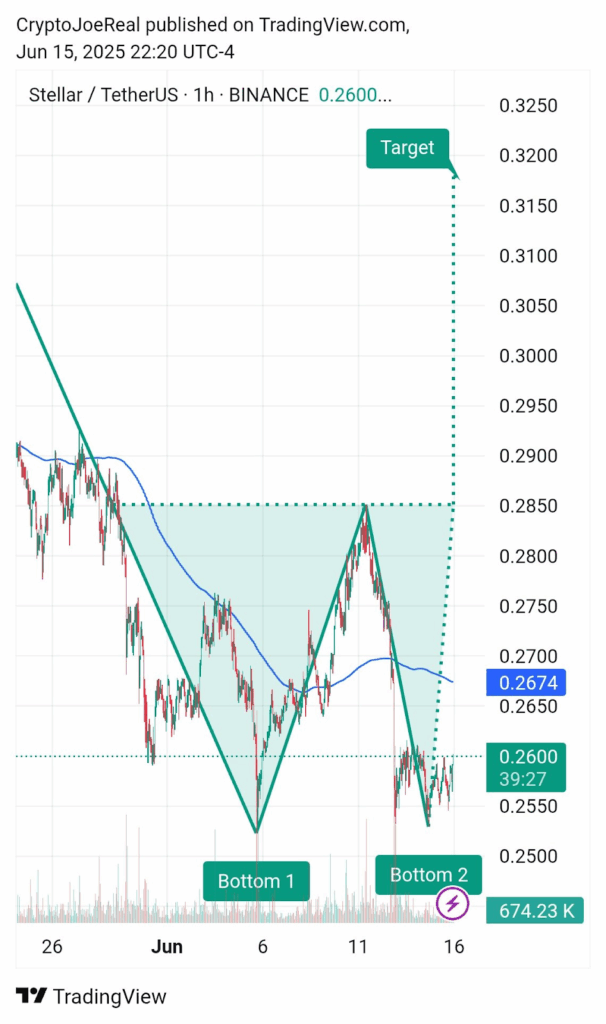
In addition, the measured move from the base to the neckline suggests a projected breakout target of $0.3179. This represents a 22% upside from the current price of $0.2600, contingent on a successful breakout above resistance.
Furthermore, as the analyst noted, the volume dynamics support the bullish setup, as trading activity is high, at the second bottom.
This is a case of build-up by investors as a breakout is expected. The 200-period moving average is also located slightly above the existing quote of XLM crypto price, and this acts as a moving resistance.
The reversal pattern would be verified by a definitive close above the neckline as well as the 200-period average, justifying Stellar price target of $0.3179.
XLM Crypto Price Trades in Descending Channel
Additionally, another analyst on a 4-hour chart presented a perspective, showing Stellar (XLM) crypto price action within a prolonged descending regression channel. The analyst noted a historical peak near $0.70 followed by sustained corrective movement.
This was characterized by a series of lower highs and lower lows. XLM crypto price remained below the $0.30 resistance zone and is trading near the midline of the regression channel at $0.26.
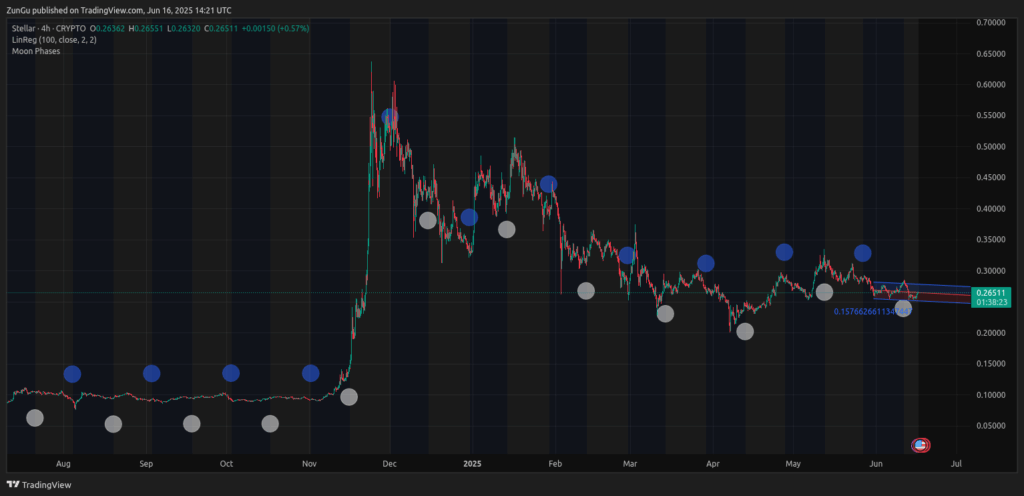
Furthermore, Fibonacci retracement lines indicate a crucial support area. Around the XLM price of $0.157, referred to as a structural bottom in case XLM crypto price cannot sustain the present-day range.
Also, the addition of the moon phases demonstrated the cyclical pattern in the movements of Stellar price. For context, full and new moons tended to coincide with the local tops and local bottoms, respectively.
Moreover, since a new moon is nearby, the analyst pointed to the possibility of a change in sentiment. However, such a signal needs confirmation either in XLM crypto price or an increase in its volume.