
Key insights:
- The STH Realized Price YoY sits at 58%, well below historic peak levels near 140%.
- Whales have accumulated over 43,100 BTC worth nearly $4 Billion in just two weeks.
- A golden cross between the MVRV Ratio and its 365-day SMA could signal a new Bitcoin bull run.
The market is holding above $94K, and Bitcoin’s on-chain indicators are flashing bullish signals.
The STH Realized Price metric has a lot of room to grow, and whales are quietly scooping up billions in BTC. Momentum could build fast with a potential MVRV crossover and bullish price pattern
STH Realized Price Still Low Compared to Previous Cycles
According to the recent CryptoQuant data, the Short-Term Holder (STH) Year-over-Year (YoY) Realized Price metric is at 58%.
This metric is the current average price paid by short-term holders over one year. It has historically played a key role in spotting market tops.
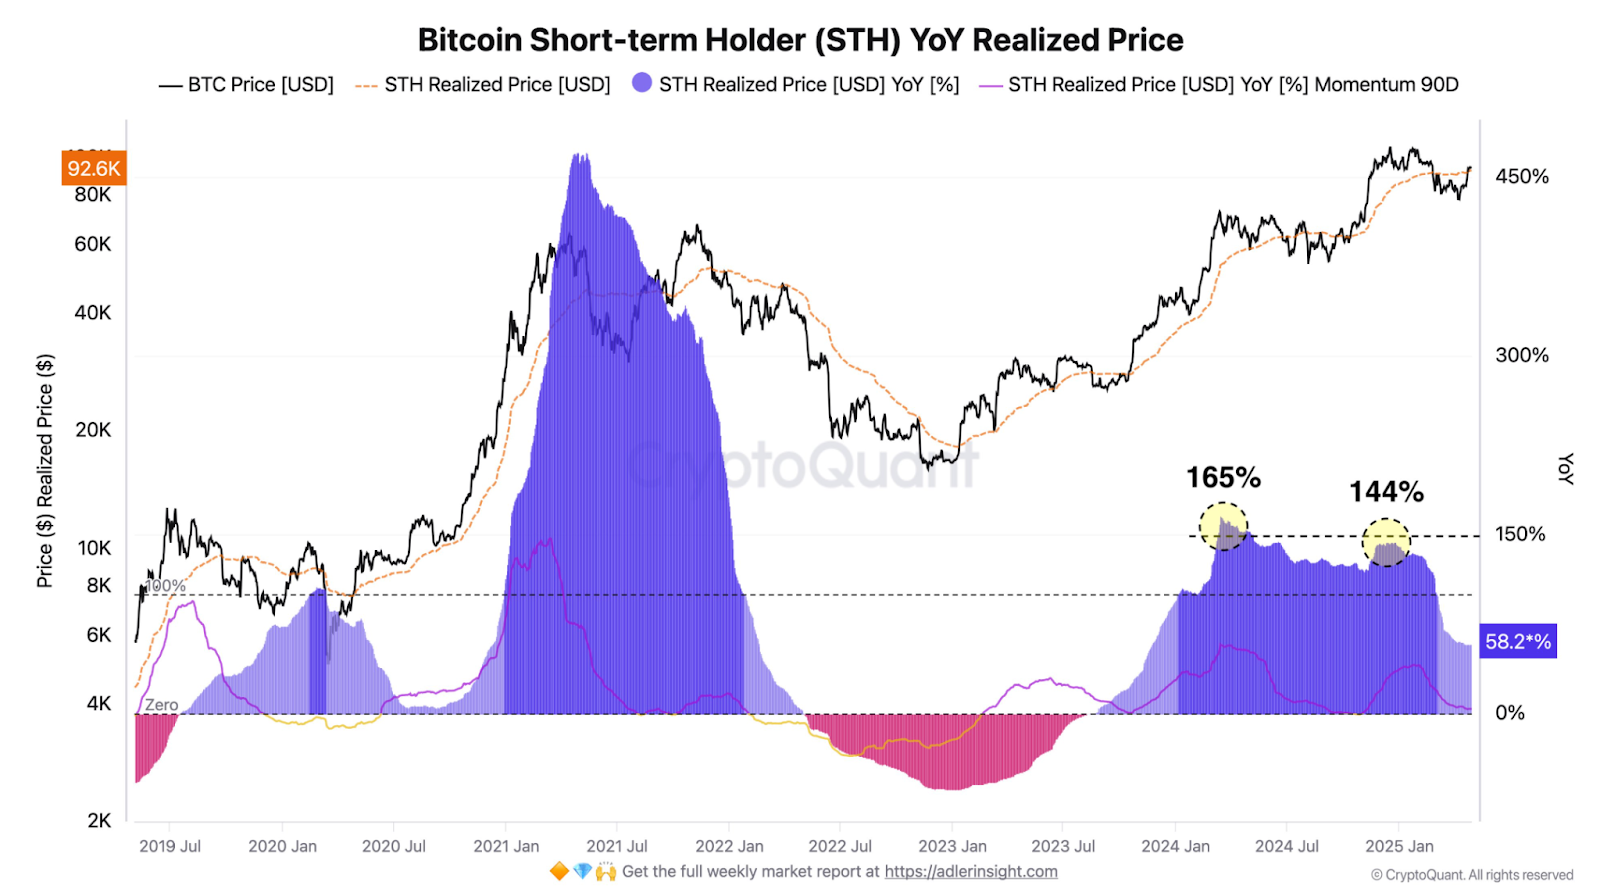
This metric was 165% during the early 2021 rally and 144% during the late 2024 rally in the previous cycle.
They happened near Bitcoin’s all-time high of around $70,000 and $100,000. If the same metric were to return to a 144% reading, it would require the asset to hit around $171,000 at today’s price of $94,000.
That indicates there is still potential for the current cycle to grow before reaching levels of profit taking similar to the past.
Whales Increase Holdings by Over 43,000 BTC
Even though STH metrics show restrained realized profits, whales are still accumulating.
According to data from CryptoQuant, whales have accumulated over 43,100 BTC in the past two weeks. At current market prices, this amount is worth nearly $4 Billion.
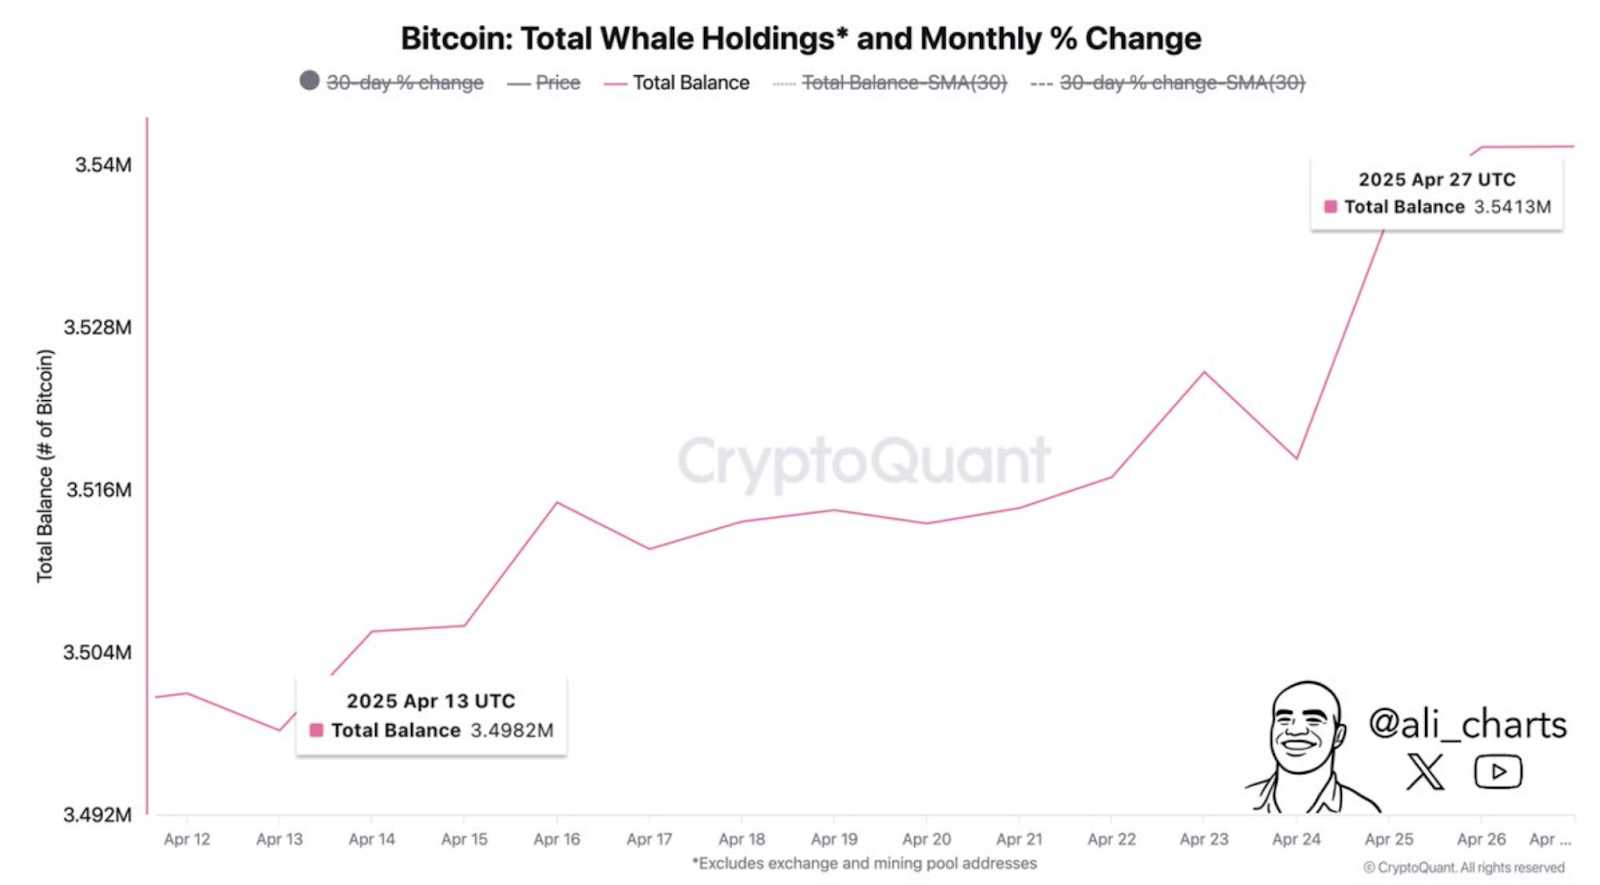
Whale wallets’ total balance increased from about 3.4982 million BTC on April 13 to 3.5413 million BTC on April 27. The steady increase in holdings implies that larger investors are positioning for future upside.
While short term sentiment has been mixed in recent sessions, this level of whale buying provides additional support to the ongoing support for Bitcoin.
And if it continues to accumulate at this pace, it could serve as a buffer against steep falls, particularly in times of uncertainty.
MVRV Ratio Approaches Bullish Cross
Another metric that’s been moving interestingly is the MVRV Ratio (Market Value to Realized Value).
It compares the amount of money invested in the Bitcoin network with the market capitalization of Bitcoin.
Currently, the MVRV Ratio is at 2.1, close to crossing above its 365-day simple moving average (SMA).
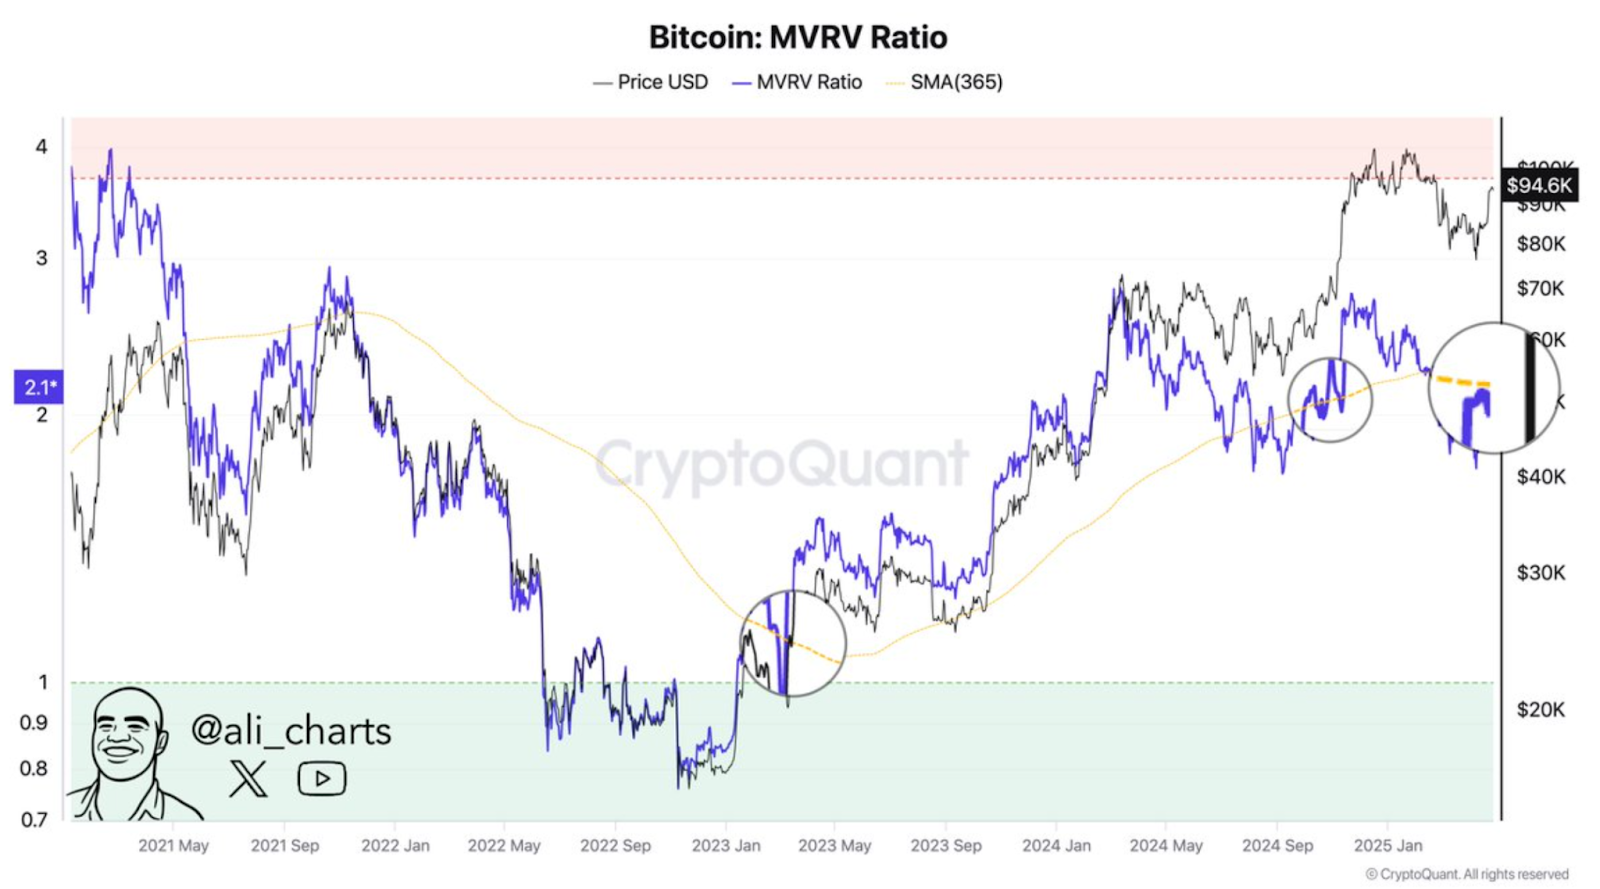
Historically, a golden cross between the MVRV and its 365-day SMA has been the start of new bullish phases.
CryptoQuant’s chart highlights this crossover with a yellow line, and the MVRV curve itself appears to be moving upward again.
Should the MVRV ratio continue to increase and break above the long-term average, it may be a sign of renewed buying strength.
This would be supportive of the idea that the broader market is moving out of a reaccumulation phase.
Bitcoin was nearing or hitting local tops at previous MVRV highs above 3.5.
Because current levels are so much lower, the market could still have room to grow before repeating those patterns.
Ascending Triangle on Short-Term Chart Suggests $99K Breakout
From a technical analysis point of view, Bitcoin is forming an ascending triangle in the short-term price action.
This is usually considered a continuation pattern where horizontal resistance is tested multiple times and higher lows are created to support.
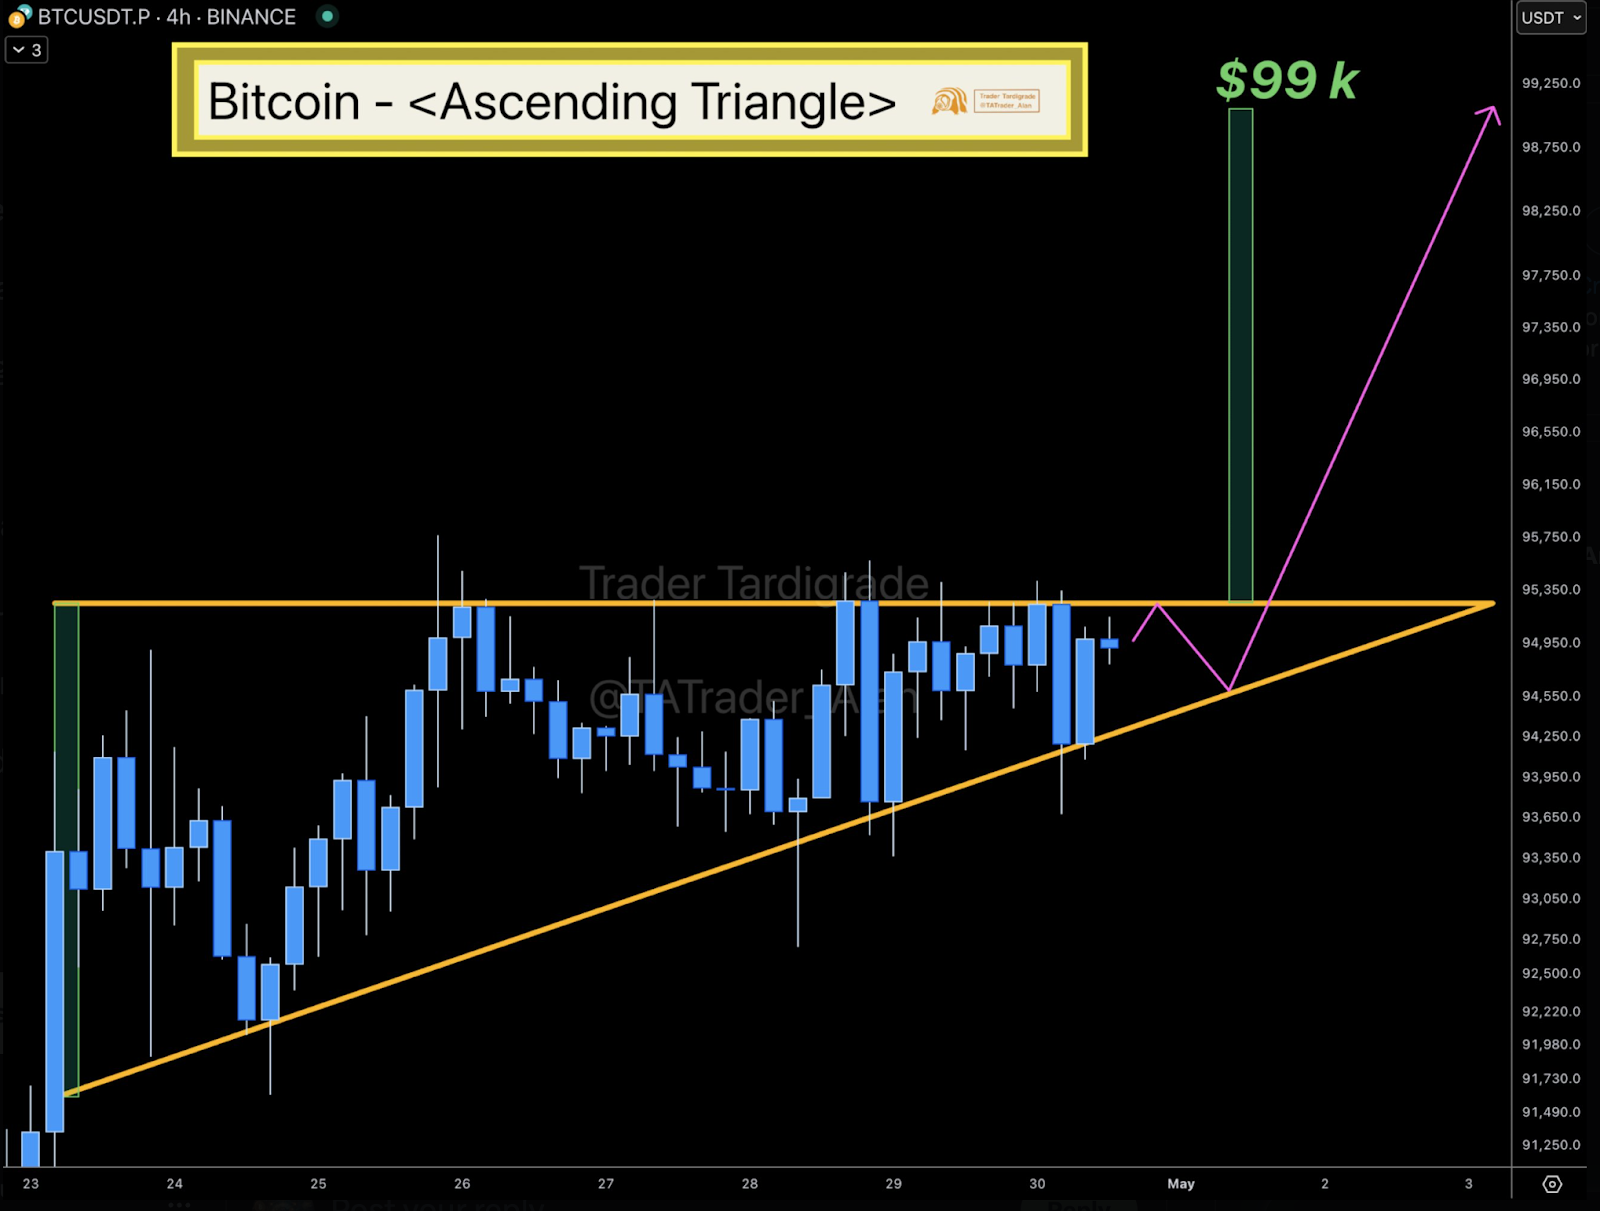
Trader Tardigrade shared this chart, which makes this structure clear. At $95,350, there is the resistance zone, while at $93,650, the upward sloping trendline is holding.
The pattern implies a target of about $99,000 if the price breaks above the resistance level.
Long-term metrics look for more upside, but short-term charts will be important for tracking entry and exit points.
With rising whale holdings, a potential MVRV crossover, and bullish technical patterns, it seems that institutional and retail players are increasingly interested in the asset.